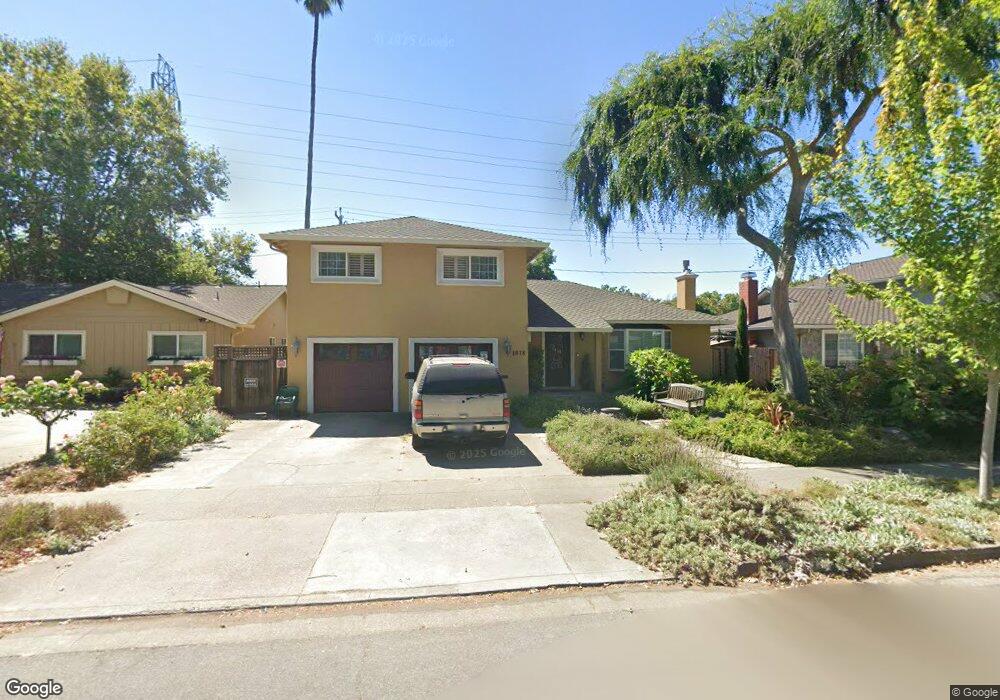
1878 Shulman Ave San Jose, CA 95124
Cambrian NeighborhoodEstimated Value: $1,940,000 - $2,321,000
3
Beds
3
Baths
1,872
Sq Ft
$1,150/Sq Ft
Est. Value
About This Home
This home is located at 1878 Shulman Ave, San Jose, CA 95124 and is currently estimated at $2,152,974, approximately $1,150 per square foot. 1878 Shulman Ave is a home located in Santa Clara County with nearby schools including Bagby Elementary School, Branham High School, and Fammatre Elementary School.
Ownership History
Date
Name
Owned For
Owner Type
Purchase Details
Closed on
Oct 25, 2021
Sold by
Morrone Guy A and Morrone Barbara D
Bought by
Morrone Guy A
Current Estimated Value
Home Financials for this Owner
Home Financials are based on the most recent Mortgage that was taken out on this home.
Original Mortgage
$130,000
Outstanding Balance
$84,843
Interest Rate
3.09%
Mortgage Type
New Conventional
Estimated Equity
$2,068,131
Purchase Details
Closed on
Jul 26, 2002
Sold by
Morrone Guy A
Bought by
Morrone Guy A and Morrone Barbara D
Home Financials for this Owner
Home Financials are based on the most recent Mortgage that was taken out on this home.
Original Mortgage
$220,000
Interest Rate
6.52%
Purchase Details
Closed on
Oct 7, 1993
Sold by
Morrone Barbara A
Bought by
Morrone Guy A
Home Financials for this Owner
Home Financials are based on the most recent Mortgage that was taken out on this home.
Original Mortgage
$203,150
Interest Rate
6.81%
Create a Home Valuation Report for This Property
The Home Valuation Report is an in-depth analysis detailing your home's value as well as a comparison with similar homes in the area
Home Values in the Area
Average Home Value in this Area
Purchase History
| Date | Buyer | Sale Price | Title Company |
|---|---|---|---|
| Morrone Guy A | -- | Orange Coast Title | |
| Morrone Guy A | -- | First American Title Co | |
| Morrone Guy A | -- | Chicago Title Insurance Comp |
Source: Public Records
Mortgage History
| Date | Status | Borrower | Loan Amount |
|---|---|---|---|
| Open | Morrone Guy A | $130,000 | |
| Closed | Morrone Guy A | $220,000 | |
| Closed | Morrone Guy A | $203,150 |
Source: Public Records
Tax History Compared to Growth
Tax History
| Year | Tax Paid | Tax Assessment Tax Assessment Total Assessment is a certain percentage of the fair market value that is determined by local assessors to be the total taxable value of land and additions on the property. | Land | Improvement |
|---|---|---|---|---|
| 2025 | $7,286 | $467,947 | $139,375 | $328,572 |
| 2024 | $7,286 | $458,773 | $136,643 | $322,130 |
| 2023 | $7,199 | $449,778 | $133,964 | $315,814 |
| 2022 | $7,078 | $440,960 | $131,338 | $309,622 |
| 2021 | $6,816 | $432,314 | $128,763 | $303,551 |
| 2020 | $6,498 | $427,882 | $127,443 | $300,439 |
| 2019 | $6,397 | $419,494 | $124,945 | $294,549 |
| 2018 | $6,219 | $411,270 | $122,496 | $288,774 |
| 2017 | $6,058 | $403,207 | $120,095 | $283,112 |
| 2016 | $5,770 | $395,302 | $117,741 | $277,561 |
| 2015 | $5,694 | $389,365 | $115,973 | $273,392 |
| 2014 | $5,198 | $381,739 | $113,702 | $268,037 |
Source: Public Records
Map
Nearby Homes
- 2538 Saint Lawrence Dr
- 2538 Custer Dr
- 2751 Coit Dr
- 1791 Frobisher Way
- 866 Apricot Ave Unit C
- 2392 Walden Square
- 1984 Kobara Ln
- 565 Union Ave
- 521 Union Ave
- 515 Union Ave
- 2925 Newark Way
- 2122 Vizcaya Way
- 2924 Vivian Ln
- 2896 Union Ave
- 2322 Meridian Ave
- 70 Union Place
- 1741 Harte Dr
- 1829 Cabana Dr
- 1860 Leigh Ave
- 2498 Raleigh Dr