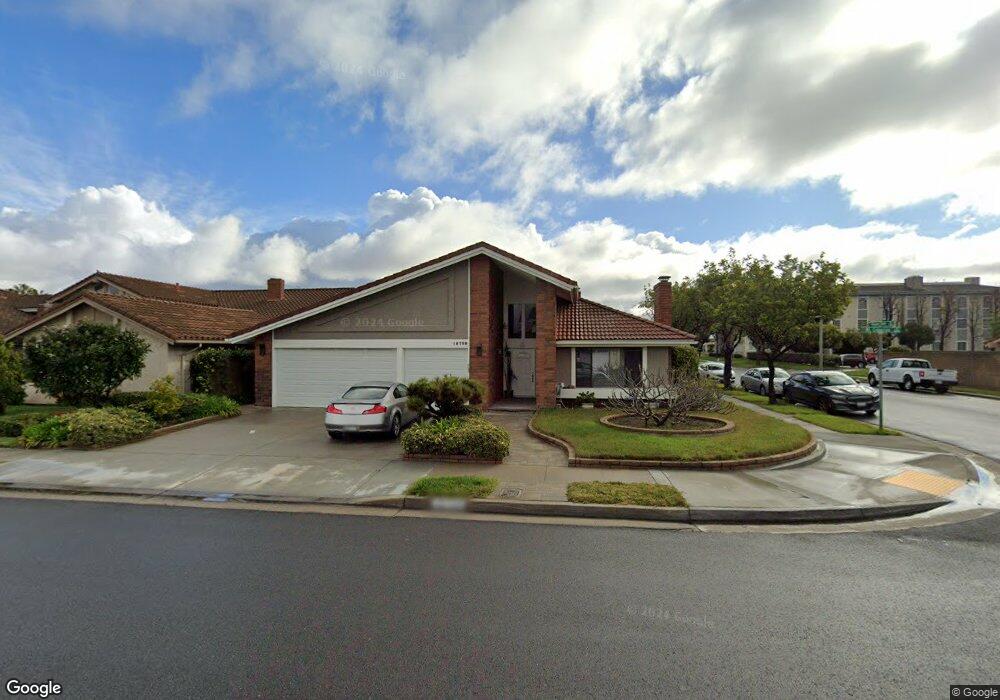
18798 Mount Cimarron St Fountain Valley, CA 92708
Estimated Value: $1,409,000 - $1,667,000
3
Beds
3
Baths
2,238
Sq Ft
$698/Sq Ft
Est. Value
About This Home
This home is located at 18798 Mount Cimarron St, Fountain Valley, CA 92708 and is currently estimated at $1,562,232, approximately $698 per square foot. 18798 Mount Cimarron St is a home located in Orange County with nearby schools including Gisler (Robert) Elementary School, Talbert Middle School, and Fountain Valley High School.
Ownership History
Date
Name
Owned For
Owner Type
Purchase Details
Closed on
Nov 3, 2000
Sold by
Seidner Melissa
Bought by
Seidner Kenneth A
Current Estimated Value
Purchase Details
Closed on
Sep 22, 1995
Sold by
Schreiner Terrance M and Schreiner Carolyn A
Bought by
Seidner Kenneth A and Seidner Melissa R
Home Financials for this Owner
Home Financials are based on the most recent Mortgage that was taken out on this home.
Original Mortgage
$203,150
Interest Rate
7.59%
Purchase Details
Closed on
Jan 7, 1994
Sold by
Schreiner Terrance M and Schreiner Carolyn A
Bought by
Schreiner Terrance M and Schreiner Carolyn A
Home Financials for this Owner
Home Financials are based on the most recent Mortgage that was taken out on this home.
Original Mortgage
$262,500
Interest Rate
7.29%
Create a Home Valuation Report for This Property
The Home Valuation Report is an in-depth analysis detailing your home's value as well as a comparison with similar homes in the area
Home Values in the Area
Average Home Value in this Area
Purchase History
| Date | Buyer | Sale Price | Title Company |
|---|---|---|---|
| Seidner Kenneth A | -- | Chicago Title Co | |
| Seidner Kenneth A | $296,000 | Continental Lawyers Title | |
| Schreiner Terrance M | -- | Continental Lawyers Title Co |
Source: Public Records
Mortgage History
| Date | Status | Borrower | Loan Amount |
|---|---|---|---|
| Closed | Seidner Kenneth A | $203,150 | |
| Previous Owner | Schreiner Terrance M | $262,500 |
Source: Public Records
Tax History Compared to Growth
Tax History
| Year | Tax Paid | Tax Assessment Tax Assessment Total Assessment is a certain percentage of the fair market value that is determined by local assessors to be the total taxable value of land and additions on the property. | Land | Improvement |
|---|---|---|---|---|
| 2025 | $5,512 | $491,725 | $256,629 | $235,096 |
| 2024 | $5,512 | $482,084 | $251,597 | $230,487 |
| 2023 | $5,381 | $472,632 | $246,664 | $225,968 |
| 2022 | $5,300 | $463,365 | $241,827 | $221,538 |
| 2021 | $5,197 | $454,280 | $237,085 | $217,195 |
| 2020 | $5,166 | $449,622 | $234,654 | $214,968 |
| 2019 | $5,061 | $440,806 | $230,053 | $210,753 |
| 2018 | $4,963 | $432,163 | $225,542 | $206,621 |
| 2017 | $4,884 | $423,690 | $221,120 | $202,570 |
| 2016 | $4,675 | $415,383 | $216,784 | $198,599 |
| 2015 | $4,603 | $409,144 | $213,528 | $195,616 |
| 2014 | $4,511 | $401,130 | $209,345 | $191,785 |
Source: Public Records
Map
Nearby Homes
- 18662 Dawn St
- 9850 Garfield Ave Unit 129
- 9850 Garfield Ave Unit 18
- 9850 Garfield Ave Unit 91
- 9850 Garfield Ave Unit 35
- 9850 Garfield Ave Unit 5
- 9850 Garfield Ave Unit 130
- 9850 Garfield Ave Unit 33
- 19251 Brookhurst St Unit 137
- 19251 Brookhurst St Unit 13
- 19251 Brookhurst St Unit 48
- 19251 Brookhurst St Unit 11
- 19251 Brookhurst St Unit 38
- 19251 Brookhurst St Unit 69
- 19251 Brookhurst St Unit 22
- 10151 Kukui Dr
- 10200 Peregrine Cir
- 18820 Cordata St
- 9462 Litchfield Dr
- 300 Magpie Ln
- 18786 Mount Cimarron St
- 18822 Mount Cimarron St
- 18774 Mount Cimarron St
- 18807 Mount Cimarron St
- 18793 Mount Cimarron St
- 18819 Mount Cimarron St
- 18836 Mount Cimarron St
- 18762 Mount Cimarron St
- 9897 Red River Cir
- 18831 Mount Cimarron St
- 9874 Red River Cir
- 18850 Mount Cimarron St
- 9875 James River Cir
- 9883 Red River Cir
- 9862 Red River Cir
- 18855 Mount Cimarron St
- 18862 Mount Cimarron St
- 9863 James River Cir
- 9869 Red River Cir
- 9850 Red River Cir