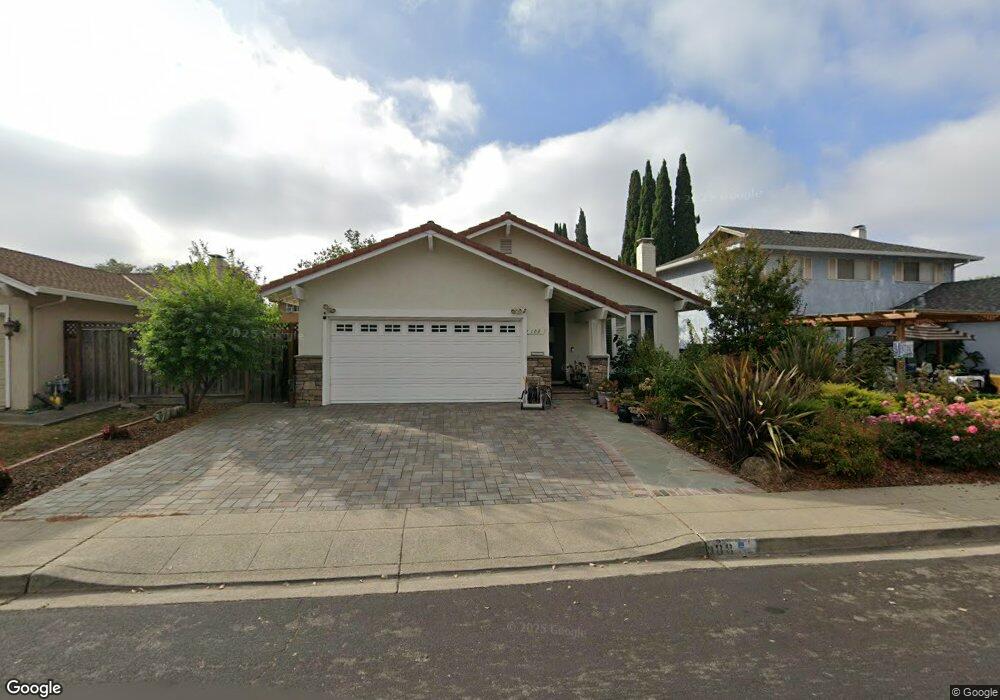
188 Greentree Way Milpitas, CA 95035
Estimated Value: $1,148,000 - $1,399,000
3
Beds
2
Baths
1,190
Sq Ft
$1,077/Sq Ft
Est. Value
About This Home
This home is located at 188 Greentree Way, Milpitas, CA 95035 and is currently estimated at $1,281,673, approximately $1,077 per square foot. 188 Greentree Way is a home located in Santa Clara County with nearby schools including Pearl Zanker Elementary School, Rancho Milpitas Middle School, and Milpitas High School.
Ownership History
Date
Name
Owned For
Owner Type
Purchase Details
Closed on
Oct 26, 2005
Sold by
Bach Tung
Bought by
Bach Tung and Bach Trung T
Current Estimated Value
Home Financials for this Owner
Home Financials are based on the most recent Mortgage that was taken out on this home.
Original Mortgage
$275,000
Outstanding Balance
$147,345
Interest Rate
5.68%
Mortgage Type
Fannie Mae Freddie Mac
Estimated Equity
$1,134,328
Purchase Details
Closed on
Jan 4, 1999
Sold by
Vanhuynh Tai and Nguyen Mai
Bought by
Bach Tung
Home Financials for this Owner
Home Financials are based on the most recent Mortgage that was taken out on this home.
Original Mortgage
$161,000
Interest Rate
6.66%
Purchase Details
Closed on
Mar 2, 1995
Sold by
Otay William R and Otay Sharon
Bought by
Bach Tung and Vanhuynh Tai Van
Home Financials for this Owner
Home Financials are based on the most recent Mortgage that was taken out on this home.
Original Mortgage
$164,800
Interest Rate
9.21%
Create a Home Valuation Report for This Property
The Home Valuation Report is an in-depth analysis detailing your home's value as well as a comparison with similar homes in the area
Home Values in the Area
Average Home Value in this Area
Purchase History
| Date | Buyer | Sale Price | Title Company |
|---|---|---|---|
| Bach Tung | $275,000 | First American Title Company | |
| Bach Tung | $80,500 | American Title Co | |
| Bach Tung | $206,000 | Santa Clara Land Title Co |
Source: Public Records
Mortgage History
| Date | Status | Borrower | Loan Amount |
|---|---|---|---|
| Open | Bach Tung | $275,000 | |
| Previous Owner | Bach Tung | $161,000 | |
| Previous Owner | Bach Tung | $164,800 |
Source: Public Records
Tax History
| Year | Tax Paid | Tax Assessment Tax Assessment Total Assessment is a certain percentage of the fair market value that is determined by local assessors to be the total taxable value of land and additions on the property. | Land | Improvement |
|---|---|---|---|---|
| 2025 | $4,724 | $397,484 | $167,385 | $230,099 |
| 2024 | $4,724 | $389,691 | $164,103 | $225,588 |
| 2023 | $4,724 | $382,051 | $160,886 | $221,165 |
| 2022 | $4,692 | $374,561 | $157,732 | $216,829 |
| 2021 | $4,625 | $367,218 | $154,640 | $212,578 |
| 2020 | $4,545 | $363,454 | $153,055 | $210,399 |
| 2019 | $4,496 | $356,328 | $150,054 | $206,274 |
| 2018 | $4,276 | $349,342 | $147,112 | $202,230 |
| 2017 | $4,222 | $342,493 | $144,228 | $198,265 |
| 2016 | $4,050 | $335,778 | $141,400 | $194,378 |
| 2015 | $4,009 | $330,736 | $139,277 | $191,459 |
| 2014 | $3,893 | $324,258 | $136,549 | $187,709 |
Source: Public Records
Map
Nearby Homes
- 1111 Stellar Way
- 1503 Canal St
- 27 S Main St
- 1864 Lee Way
- 2077 Lee Way
- 275 Currlin Cir
- 287 Wild Rose Way
- 225 Houret Dr
- 39 Cloud Walk Unit 328
- 59 Wind Song
- 1768 Capulet Dr
- 1759 Capulet Dr
- 337 Montague Expy
- 430 Montague Expy Unit 20
- 460 Montague Expy Unit 40
- 330 Riesling Ave Unit 23
- 1625 Delano St Unit 23
- 2151 Old Oakland Rd Unit 324
- 2151 Oakland Rd Unit 523
- 2151 Oakland Rd Unit 552
- 190 Greentree Way
- 176 Greentree Way
- 181 Lonetree Ct
- 173 Lonetree Ct
- 202 Greentree Way
- 164 Greentree Way
- 187 Lonetree Ct
- 161 Lonetree Ct
- 181 Greentree Way
- 193 Lonetree Ct
- 189 Greentree Way
- 153 Lonetree Ct
- 175 Greentree Way
- 214 Greentree Way
- 197 Greentree Way
- 201 Lonetree Ct
- 152 Greentree Way
- 147 Lonetree Ct
- 167 Greentree Way
- 209 Lonetree Ct
Your Personal Tour Guide
Ask me questions while you tour the home.