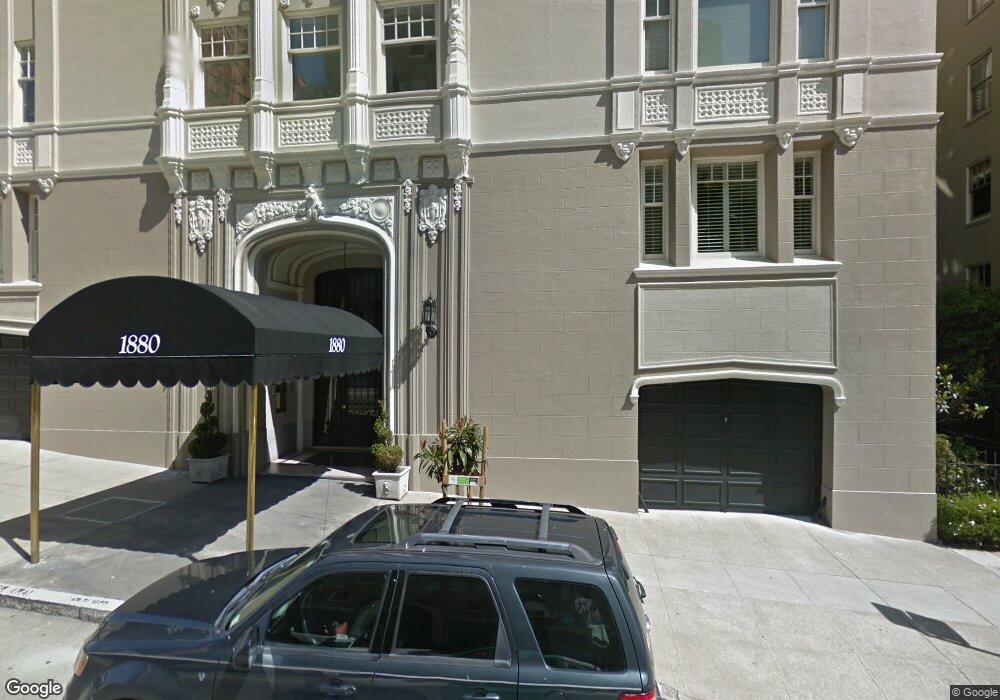
1880 Jackson St Unit 605 San Francisco, CA 94109
Pacific Heights NeighborhoodEstimated Value: $1,266,760 - $1,539,000
1
Bed
2
Baths
1,115
Sq Ft
$1,252/Sq Ft
Est. Value
About This Home
This home is located at 1880 Jackson St Unit 605, San Francisco, CA 94109 and is currently estimated at $1,395,690, approximately $1,251 per square foot. 1880 Jackson St Unit 605 is a home located in San Francisco County with nearby schools including Sherman Elementary, Marina Middle School, and Mary L. Booker Leadership Academy.
Ownership History
Date
Name
Owned For
Owner Type
Purchase Details
Closed on
Feb 18, 2011
Sold by
Klearman Micki
Bought by
Klearman Micki
Current Estimated Value
Purchase Details
Closed on
May 2, 2008
Sold by
Ringwalt Jean C
Bought by
Klearman Micki
Home Financials for this Owner
Home Financials are based on the most recent Mortgage that was taken out on this home.
Original Mortgage
$107,500
Outstanding Balance
$68,894
Interest Rate
6.11%
Mortgage Type
Unknown
Estimated Equity
$1,326,796
Purchase Details
Closed on
Aug 16, 2002
Sold by
Beck Jonathan A
Bought by
Ringwalt Jean C
Purchase Details
Closed on
Nov 30, 1998
Sold by
Snider Lee A
Bought by
Beck Jonathan A
Home Financials for this Owner
Home Financials are based on the most recent Mortgage that was taken out on this home.
Original Mortgage
$391,200
Interest Rate
6.69%
Create a Home Valuation Report for This Property
The Home Valuation Report is an in-depth analysis detailing your home's value as well as a comparison with similar homes in the area
Home Values in the Area
Average Home Value in this Area
Purchase History
| Date | Buyer | Sale Price | Title Company |
|---|---|---|---|
| Klearman Micki | -- | None Available | |
| Klearman Micki | $1,125,000 | First American Title Company | |
| Ringwalt Jean C | $650,000 | First American Title Co | |
| Beck Jonathan A | $489,000 | First American Title Co |
Source: Public Records
Mortgage History
| Date | Status | Borrower | Loan Amount |
|---|---|---|---|
| Open | Klearman Micki | $107,500 | |
| Open | Klearman Micki | $843,750 | |
| Previous Owner | Beck Jonathan A | $391,200 |
Source: Public Records
Tax History Compared to Growth
Tax History
| Year | Tax Paid | Tax Assessment Tax Assessment Total Assessment is a certain percentage of the fair market value that is determined by local assessors to be the total taxable value of land and additions on the property. | Land | Improvement |
|---|---|---|---|---|
| 2025 | $17,705 | $1,477,695 | $886,618 | $591,077 |
| 2024 | $17,705 | $1,448,722 | $869,234 | $579,488 |
| 2023 | $17,429 | $1,420,317 | $852,191 | $568,126 |
| 2022 | $17,094 | $1,392,469 | $835,482 | $556,987 |
| 2021 | $16,790 | $1,365,166 | $819,100 | $546,066 |
| 2020 | $16,866 | $1,351,169 | $810,702 | $540,467 |
| 2019 | $16,287 | $1,324,676 | $794,806 | $529,870 |
| 2018 | $15,737 | $1,298,703 | $779,222 | $519,481 |
| 2017 | $15,252 | $1,273,240 | $763,944 | $509,296 |
| 2016 | $15,005 | $1,248,275 | $748,965 | $499,310 |
| 2015 | $14,470 | $1,200,000 | $780,000 | $420,000 |
| 2014 | $13,424 | $1,120,000 | $672,000 | $448,000 |
Source: Public Records
Map
Nearby Homes
- 1830 Jackson St Unit E
- 1896 Pacific Ave Unit 202
- 1896 Pacific Ave Unit 404
- 2000 Washington St Unit 4
- 2145 Franklin St Unit 1
- 2006 Washington St Unit 4
- 2040 Franklin St Unit 502
- 1701 Jackson St Unit 209
- 1701 Jackson St Unit 105
- 1925 Gough St Unit 51
- 1925 Gough St Unit 22
- 1650 Broadway Unit 104
- 1971 Broadway
- 1623 Vallejo St
- 1940 Broadway Unit 2W
- 1868 Van Ness Ave Unit 406
- 2160 Van Ness Ave
- 1650 Jackson St Unit 707
- 1788 Clay St Unit 711
- 1740 Franklin St Unit 10
- 1880 Jackson St
- 1880 Jackson St Unit 401
- 1880 Jackson St Unit 305
- 1880 Jackson St Unit 304
- 1880 Jackson St Unit 303
- 1880 Jackson St Unit 302
- 1880 Jackson St Unit 301
- 1880 Jackson St Unit 205
- 1880 Jackson St Unit 204
- 1880 Jackson St Unit 203
- 1880 Jackson St Unit 202
- 1880 Jackson St Unit 201
- 1880 Jackson St Unit 105
- 1880 Jackson St Unit 104
- 1880 Jackson St Unit 103
- 1880 Jackson St Unit 102
- 1880 Jackson St Unit 101
- 1880 Jackson St Unit 604
- 1880 Jackson St Unit 603
- 1880 Jackson St Unit 602