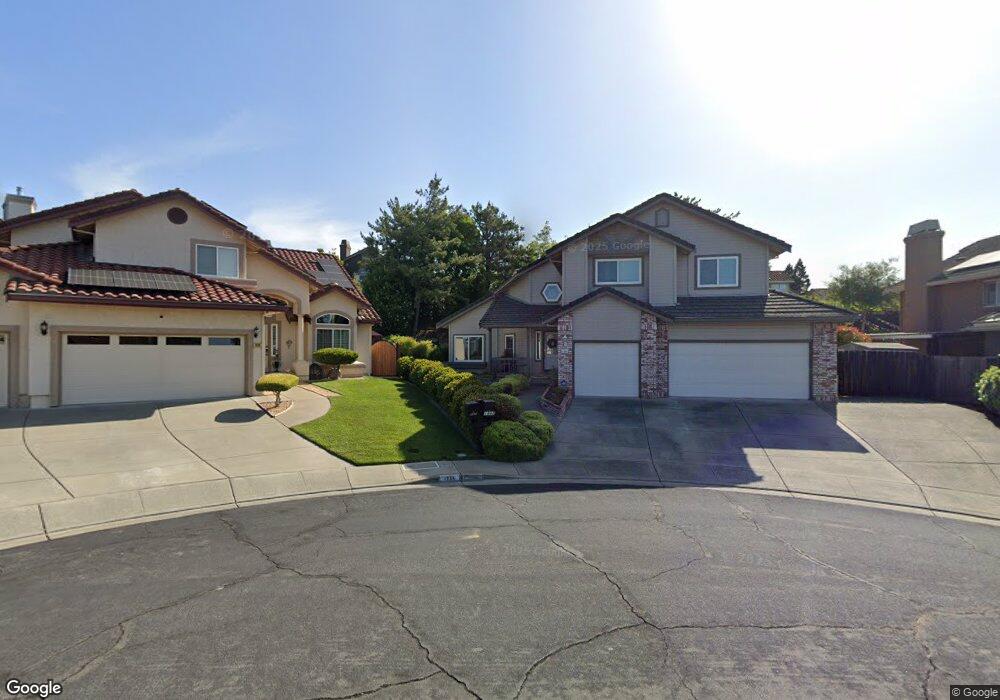
1880 Kolob Dr Fairfield, CA 94534
Estimated Value: $690,402 - $753,000
5
Beds
3
Baths
2,557
Sq Ft
$286/Sq Ft
Est. Value
About This Home
This home is located at 1880 Kolob Dr, Fairfield, CA 94534 and is currently estimated at $731,601, approximately $286 per square foot. 1880 Kolob Dr is a home located in Solano County with nearby schools including K. I. Jones Elementary School, Angelo Rodriguez High School, and We R Family Christian School.
Ownership History
Date
Name
Owned For
Owner Type
Purchase Details
Closed on
Jan 31, 2011
Sold by
Bruce Edward R and Bruce Suzanne C
Bought by
Bruce Edward R and Bruce Suzanne C
Current Estimated Value
Purchase Details
Closed on
Feb 20, 1997
Sold by
Forrester Jackie L and Forrester K J
Bought by
Bruce Edward R and Bruce Suzanne C
Home Financials for this Owner
Home Financials are based on the most recent Mortgage that was taken out on this home.
Original Mortgage
$208,800
Outstanding Balance
$23,477
Interest Rate
7.5%
Estimated Equity
$708,124
Purchase Details
Closed on
Oct 21, 1993
Sold by
Forrester Jackie and Forrester Karen
Bought by
Forrester Jackie L and Forrester Karen J
Home Financials for this Owner
Home Financials are based on the most recent Mortgage that was taken out on this home.
Original Mortgage
$203,150
Interest Rate
6.95%
Create a Home Valuation Report for This Property
The Home Valuation Report is an in-depth analysis detailing your home's value as well as a comparison with similar homes in the area
Purchase History
| Date | Buyer | Sale Price | Title Company |
|---|---|---|---|
| Bruce Edward R | -- | None Available | |
| Bruce Edward R | $232,000 | Frontier Title Company | |
| Forrester Jackie L | -- | -- |
Source: Public Records
Mortgage History
| Date | Status | Borrower | Loan Amount |
|---|---|---|---|
| Open | Bruce Edward R | $208,800 | |
| Previous Owner | Forrester Jackie L | $203,150 |
Source: Public Records
Tax History
| Year | Tax Paid | Tax Assessment Tax Assessment Total Assessment is a certain percentage of the fair market value that is determined by local assessors to be the total taxable value of land and additions on the property. | Land | Improvement |
|---|---|---|---|---|
| 2025 | $4,548 | $377,849 | $114,004 | $263,845 |
| 2024 | $4,548 | $370,441 | $111,769 | $258,672 |
| 2023 | $4,419 | $363,178 | $109,578 | $253,600 |
| 2022 | $4,369 | $356,058 | $107,430 | $248,628 |
| 2021 | $4,328 | $349,077 | $105,324 | $243,753 |
| 2020 | $4,236 | $345,499 | $104,245 | $241,254 |
| 2019 | $4,140 | $338,725 | $102,201 | $236,524 |
| 2018 | $4,259 | $332,085 | $100,198 | $231,887 |
| 2017 | $4,079 | $325,575 | $98,234 | $227,341 |
| 2016 | $4,049 | $319,192 | $96,308 | $222,884 |
| 2015 | $3,805 | $314,399 | $94,862 | $219,537 |
| 2014 | $3,773 | $308,241 | $93,004 | $215,237 |
Source: Public Records
Map
Nearby Homes
- 3456 Norwalk Place
- 3511 Norwalk Place
- 3451 Nantucket Dr
- 2125 Mecca Ct
- 3114 Lomita Ct
- 2903 Burbank Dr
- 185 Canby Way
- 1518 Astoria Dr
- 2848 Howe Ct
- 2810 Miller Ct
- 1437 Shelby Dr
- 3327 Colonial Ct Unit 1
- 2837 Watson Ct
- 2795 Vista Palomar
- 2045 Dorland Dr
- 2051 Barbour Dr
- 1858 Barbour Dr
- 1866 New Jersey St
- 4589 Abernathy Rd
- 1949 New Jersey St
Your Personal Tour Guide
Ask me questions while you tour the home.