1881 Swansboro Rd Placerville, CA 95667
Estimated Value: $447,000 - $502,160
4
Beds
3
Baths
2,313
Sq Ft
$206/Sq Ft
Est. Value
About This Home
This home is located at 1881 Swansboro Rd, Placerville, CA 95667 and is currently estimated at $476,053, approximately $205 per square foot. 1881 Swansboro Rd is a home located in El Dorado County with nearby schools including El Dorado High School.
Ownership History
Date
Name
Owned For
Owner Type
Purchase Details
Closed on
May 6, 2025
Sold by
Weiland Karl B and Weiland Heidi A
Bought by
Weiland Family Trust and Weiland
Current Estimated Value
Purchase Details
Closed on
Nov 22, 2004
Sold by
Weiland Karl
Bought by
Weiland Karl and Weiland Heidi
Purchase Details
Closed on
Nov 24, 2003
Sold by
Weiland Karl B and Weiland Heidi A
Bought by
Weiland Karl
Home Financials for this Owner
Home Financials are based on the most recent Mortgage that was taken out on this home.
Original Mortgage
$165,000
Interest Rate
6.04%
Mortgage Type
Unknown
Purchase Details
Closed on
Nov 19, 2003
Sold by
Va
Bought by
Weiland Karl B and Weiland Heidi A
Home Financials for this Owner
Home Financials are based on the most recent Mortgage that was taken out on this home.
Original Mortgage
$165,000
Interest Rate
6.04%
Mortgage Type
Unknown
Create a Home Valuation Report for This Property
The Home Valuation Report is an in-depth analysis detailing your home's value as well as a comparison with similar homes in the area
Purchase History
| Date | Buyer | Sale Price | Title Company |
|---|---|---|---|
| Weiland Family Trust | -- | None Listed On Document | |
| Weiland Karl | -- | -- | |
| Weiland Karl | -- | Chicago Title Co | |
| Weiland Karl B | -- | Chicago Title Co |
Source: Public Records
Mortgage History
| Date | Status | Borrower | Loan Amount |
|---|---|---|---|
| Previous Owner | Weiland Karl | $165,000 |
Source: Public Records
Tax History
| Year | Tax Paid | Tax Assessment Tax Assessment Total Assessment is a certain percentage of the fair market value that is determined by local assessors to be the total taxable value of land and additions on the property. | Land | Improvement |
|---|---|---|---|---|
| 2025 | $3,313 | $304,568 | $61,871 | $242,697 |
| 2024 | $3,313 | $298,597 | $60,658 | $237,939 |
| 2023 | $3,276 | $292,743 | $59,469 | $233,274 |
| 2022 | $3,231 | $287,003 | $58,303 | $228,700 |
| 2021 | $3,196 | $281,376 | $57,160 | $224,216 |
| 2020 | $3,151 | $278,491 | $56,574 | $221,917 |
| 2019 | $3,114 | $273,031 | $55,465 | $217,566 |
| 2018 | $3,025 | $267,678 | $54,378 | $213,300 |
| 2017 | $2,982 | $262,430 | $53,312 | $209,118 |
| 2016 | $2,937 | $257,285 | $52,267 | $205,018 |
| 2015 | $2,811 | $253,423 | $51,483 | $201,940 |
| 2014 | $2,811 | $248,462 | $50,476 | $197,986 |
Source: Public Records
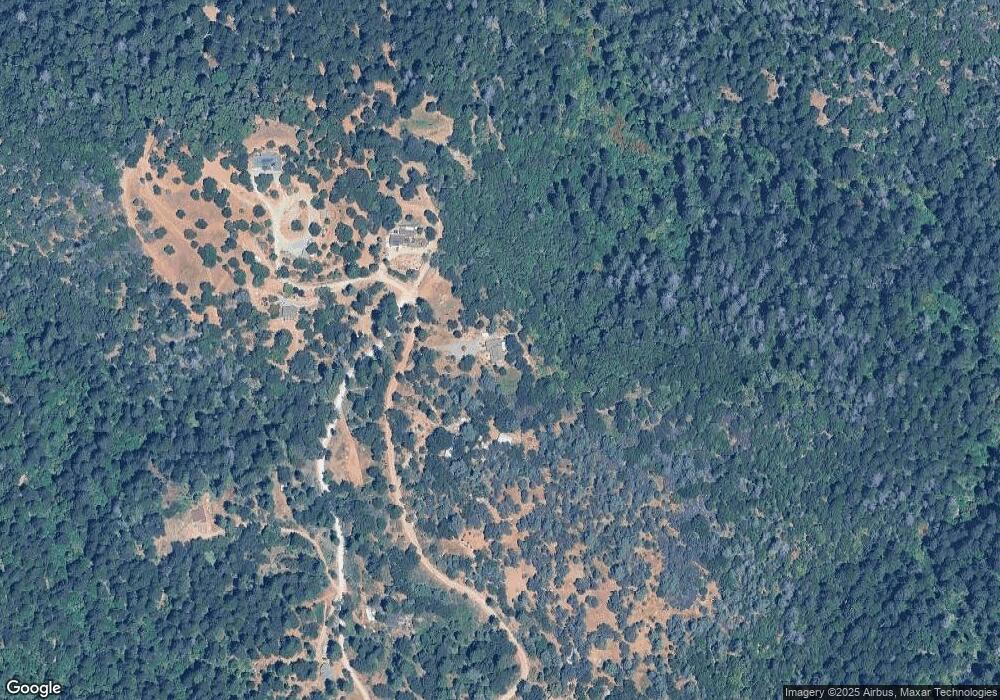
Map
Nearby Homes
- 1610 Swansboro Rd
- 1767 Swansboro Rd
- 2639 Gold Ct
- 9030 Orval Beckett Ct
- 3200 1 Eye Creek Rd
- 2597 Shilo Dr
- 2629 Shilo Dr
- 6281 Bear Creek Rd
- 3000 Gravel Ct
- 2767 Shilo Dr
- 3025 Buckboard Rd
- 10180 Rock Creek Rd
- 4717 Lobo Trail
- 7021 Stope Ct
- 3561 Stope Dr
- 3800 Dogwood Ln
- 6400 Shoo Fly Rd
- 6410 Log Cabin Ln
- 3196 Pine Cone Ct
- 6560 Log Cabin Ln
- 1900 Swansboro Rd
- 1841 Swansboro Rd
- 2037 Junco Ct
- 2000 Junco Ct
- 1861 Swansboro Rd
- 1783 Swansboro Rd
- 2001 Swansboro Rd
- 2021 Swansboro Rd
- 1771 Swansboro Rd
- 2000 Swansboro Rd
- 1637 Swansboro Rd
- 1640 Swansboro Rd
- 2120 Rex Ct
- 9 Swansboro Rd
- XXX Rex Ct
- 999 Rex Ct
- 2 Rex Ct
- 2121 Swansboro Rd
- 1636 Swansboro Rd
- 2130 Swansboro Rd
Your Personal Tour Guide
Ask me questions while you tour the home.