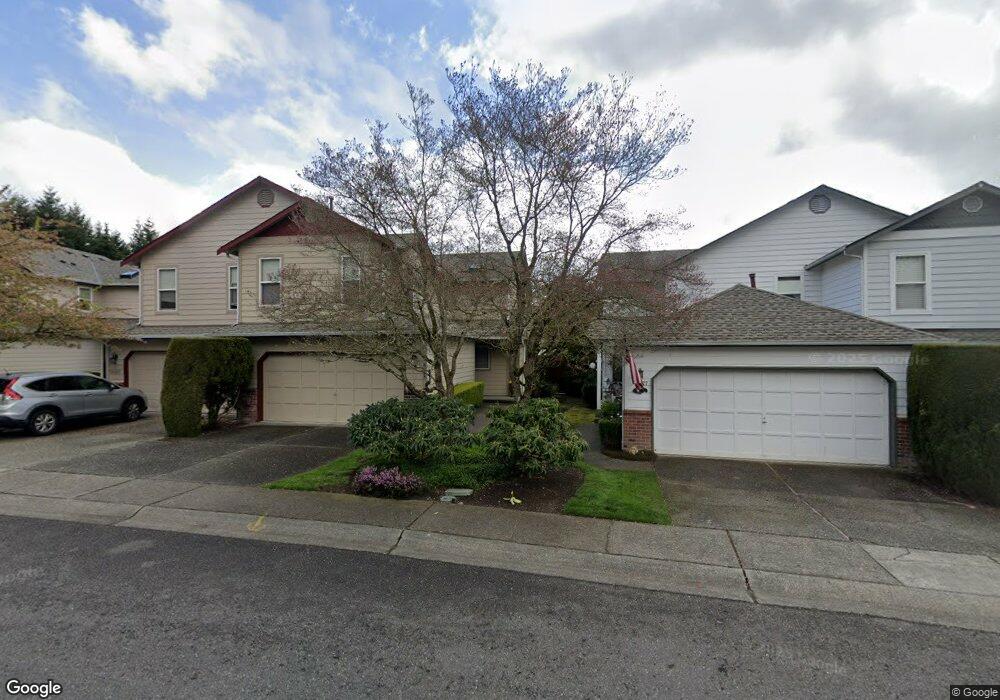
18825 19th Dr SE Bothell, WA 98012
North Creek NeighborhoodEstimated Value: $709,000 - $755,000
3
Beds
3
Baths
1,540
Sq Ft
$476/Sq Ft
Est. Value
About This Home
This home is located at 18825 19th Dr SE, Bothell, WA 98012 and is currently estimated at $732,593, approximately $475 per square foot. 18825 19th Dr SE is a home located in Snohomish County with nearby schools including Tambark Creek Elementary School, Heatherwood Middle School, and Henry M. Jackson High School.
Ownership History
Date
Name
Owned For
Owner Type
Purchase Details
Closed on
Jul 24, 2007
Sold by
Smith Carol L and Smith Brent L
Bought by
Smith Carol L
Current Estimated Value
Purchase Details
Closed on
Oct 4, 2006
Sold by
Arndt Robert C
Bought by
Smith Brent L and Smith Carol L
Home Financials for this Owner
Home Financials are based on the most recent Mortgage that was taken out on this home.
Original Mortgage
$155,000
Outstanding Balance
$89,433
Interest Rate
6.43%
Mortgage Type
Purchase Money Mortgage
Estimated Equity
$643,160
Purchase Details
Closed on
May 24, 2000
Sold by
Macdonald Margi
Bought by
Arndt Robert C
Purchase Details
Closed on
Apr 8, 1996
Sold by
Metco Construction Inc
Bought by
Macdonald Margi
Home Financials for this Owner
Home Financials are based on the most recent Mortgage that was taken out on this home.
Original Mortgage
$100,000
Interest Rate
7.41%
Create a Home Valuation Report for This Property
The Home Valuation Report is an in-depth analysis detailing your home's value as well as a comparison with similar homes in the area
Home Values in the Area
Average Home Value in this Area
Purchase History
| Date | Buyer | Sale Price | Title Company |
|---|---|---|---|
| Smith Carol L | -- | None Available | |
| Smith Brent L | $308,000 | Ticor Title | |
| Arndt Robert C | $189,615 | -- | |
| Macdonald Margi | $144,990 | -- |
Source: Public Records
Mortgage History
| Date | Status | Borrower | Loan Amount |
|---|---|---|---|
| Open | Smith Brent L | $155,000 | |
| Previous Owner | Macdonald Margi | $100,000 |
Source: Public Records
Tax History
| Year | Tax Paid | Tax Assessment Tax Assessment Total Assessment is a certain percentage of the fair market value that is determined by local assessors to be the total taxable value of land and additions on the property. | Land | Improvement |
|---|---|---|---|---|
| 2026 | $6,356 | $686,400 | $450,000 | $236,400 |
| 2025 | $5,917 | $655,400 | $425,000 | $230,400 |
| 2024 | $5,917 | $612,400 | $390,000 | $222,400 |
| 2023 | $6,481 | $736,900 | $480,000 | $256,900 |
| 2022 | $5,138 | $504,100 | $286,000 | $218,100 |
| 2020 | $5,222 | $431,200 | $244,000 | $187,200 |
| 2019 | $4,663 | $385,500 | $200,000 | $185,500 |
| 2018 | $4,522 | $340,500 | $175,000 | $165,500 |
| 2017 | $3,865 | $292,200 | $138,000 | $154,200 |
| 2016 | $3,497 | $277,600 | $128,000 | $149,600 |
| 2015 | $3,157 | $236,700 | $97,000 | $139,700 |
| 2013 | $2,990 | $198,400 | $85,000 | $113,400 |
Source: Public Records
Map
Nearby Homes
- 18809 20th Dr SE
- 19102 20th Dr SE Unit B204
- 19102 20th Dr SE Unit B202
- 19102 20th Dr SE Unit B206
- 18910 Bothell Everett Hwy Unit H2
- 18910 Bothell Everett Hwy Unit N2
- 18930 Bothell Everett Hwy Unit B-103
- 18930 Bothell Everett Hwy Unit G103
- 18930 Bothell Everett Hwy Unit G105
- 18429 20th Dr SE
- 2401 185th Place SE
- 1729 194th St SE Unit 19
- 2009 196th St SE Unit E303
- 2009 196th St SE Unit C303
- 2009 196th St SE Unit C103
- 18719 12th Dr SE
- 19218 26th Ave SE Unit 117
- 1332 192nd St SE Unit 50
- 18309 26th Dr SE
- 1322 194th St SE Unit B4
- 18827 19th Dr SE
- 18823 19th Dr SE
- 18829 19th Dr SE
- 18821 19th Dr SE
- 18831 19th Dr SE
- 18818 20th Ave SE
- 18819 19th Dr SE
- 18820 20th Ave SE
- 18814 20th Ave SE
- 18824 20th Ave SE
- 18833 19th Dr SE
- 18812 20th Ave SE
- 18817 19th Dr SE
- 18830 20th Ave SE
- 18824 19th Dr SE
- 18826 19th Dr SE
- 18808 20th Ave SE
- 18822 19th Dr SE
- 18828 19th Dr SE
- 18815 19th Dr SE
Your Personal Tour Guide
Ask me questions while you tour the home.