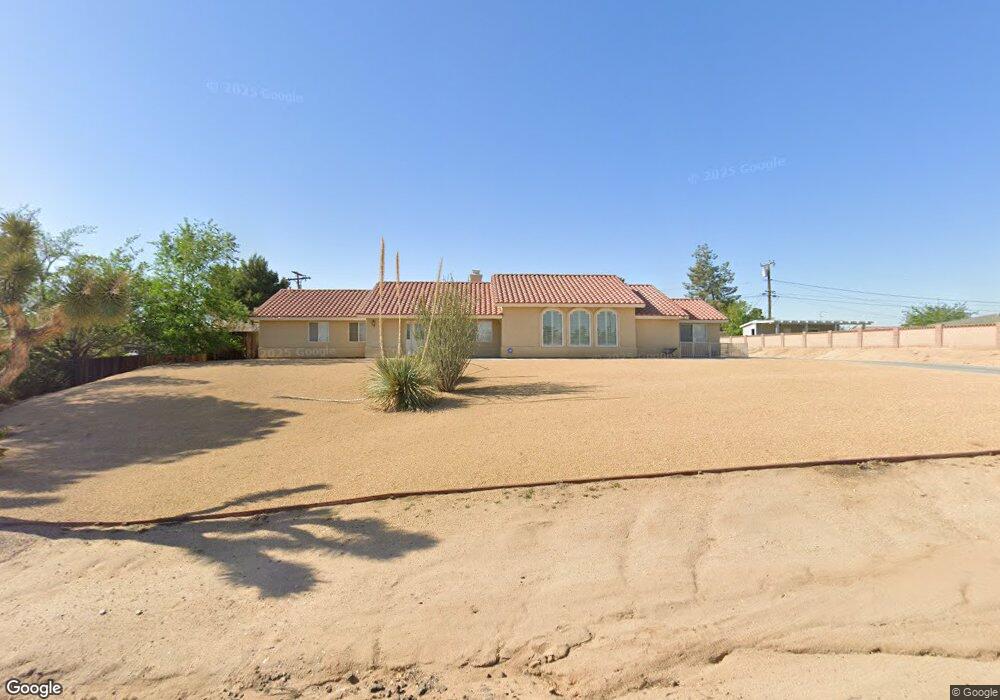
18835 Chapae Ln Apple Valley, CA 92307
High Desert NeighborhoodEstimated Value: $506,000 - $546,000
3
Beds
3
Baths
2,573
Sq Ft
$204/Sq Ft
Est. Value
About This Home
This home is located at 18835 Chapae Ln, Apple Valley, CA 92307 and is currently estimated at $524,040, approximately $203 per square foot. 18835 Chapae Ln is a home located in San Bernardino County with nearby schools including Desert Knolls Elementary School, Granite Hills High School, and Academy for Academic Excellence.
Ownership History
Date
Name
Owned For
Owner Type
Purchase Details
Closed on
Jul 28, 2011
Sold by
Audi Janice A
Bought by
Audi Janice A and Janice A Audi 2011 Trust
Current Estimated Value
Purchase Details
Closed on
Aug 30, 2002
Sold by
Lewis Steven and Lewis Victoria
Bought by
Audi Janice A
Home Financials for this Owner
Home Financials are based on the most recent Mortgage that was taken out on this home.
Original Mortgage
$214,200
Outstanding Balance
$89,348
Interest Rate
6.22%
Estimated Equity
$434,692
Purchase Details
Closed on
Apr 18, 2001
Sold by
Devlin Chris M and Devlin Susan L
Bought by
Devlin Roger and Devlin Charlene
Purchase Details
Closed on
Apr 17, 2001
Sold by
Devlin Roger and Devlin Charlene
Bought by
Lewis Steven and Lewis Victoria
Create a Home Valuation Report for This Property
The Home Valuation Report is an in-depth analysis detailing your home's value as well as a comparison with similar homes in the area
Home Values in the Area
Average Home Value in this Area
Purchase History
| Date | Buyer | Sale Price | Title Company |
|---|---|---|---|
| Audi Janice A | -- | None Available | |
| Audi Janice A | $225,500 | Commerce Title Company | |
| Devlin Roger | -- | Commonwealth Land Title Co | |
| Lewis Steven | $29,000 | Commonwealth Land Title Co |
Source: Public Records
Mortgage History
| Date | Status | Borrower | Loan Amount |
|---|---|---|---|
| Open | Audi Janice A | $214,200 |
Source: Public Records
Tax History
| Year | Tax Paid | Tax Assessment Tax Assessment Total Assessment is a certain percentage of the fair market value that is determined by local assessors to be the total taxable value of land and additions on the property. | Land | Improvement |
|---|---|---|---|---|
| 2025 | $3,735 | $326,603 | $55,525 | $271,078 |
| 2024 | $3,628 | $320,199 | $54,436 | $265,763 |
| 2023 | $3,594 | $313,921 | $53,369 | $260,552 |
| 2022 | $3,538 | $307,766 | $52,323 | $255,443 |
| 2021 | $3,456 | $301,731 | $51,297 | $250,434 |
| 2020 | $3,414 | $298,637 | $50,771 | $247,866 |
| 2019 | $3,349 | $292,781 | $49,775 | $243,006 |
| 2018 | $3,266 | $287,040 | $48,799 | $238,241 |
| 2017 | $3,220 | $281,412 | $47,842 | $233,570 |
| 2016 | $3,105 | $275,894 | $46,904 | $228,990 |
| 2015 | $3,132 | $271,749 | $46,199 | $225,550 |
| 2014 | $3,091 | $266,426 | $45,294 | $221,132 |
Source: Public Records
Map
Nearby Homes
- 18730 Chapae Ln
- 18924 Symeron Rd
- 18539 Symeron Rd
- 15650 Pohez Rd
- 2 Apple Valley Rd
- 15617 Mondamon Rd
- 15358 Apple Valley Rd
- 15103 Wilson Ct
- 15908 Acoma Rd
- 0 15771 Mondamon Rd
- 15128 Mendota Rd
- 0 Taloga Ln
- 0 Kasota Ln
- 18311 Owatonna Rd
- 15944 Wintun Rd
- 16035 Venango Rd
- 15637 Tuscola Rd
- 18965 Siskiyou Rd
- 0 Tuscola Rd Unit HD26010268
- 0 Tuscola Rd Unit HD25200058
- 1 Nancotta Rd
- 15490 Myalon Rd
- 18551 Cocqui Rd
- 18554 Cocqui Rd
- 0 Nancotta Rd
- 18830 Chapae Ln
- 18850 Chapae Ln
- 18802 Chapae Ln
- 18781 Chapae Ln
- 15470 Myalon Rd
- 15501 Myalon Rd
- 15525 Myalon Rd
- 18549 Cocqui Rd
- 18778 Chapae Ln
- 15570 Myalon Rd
- 15485 Myalon Rd
- 18558 Cocqui Rd
- 18550 Cocqui Rd
- 15555 Myalon Rd
- 15436 Myalon Rd
Your Personal Tour Guide
Ask me questions while you tour the home.