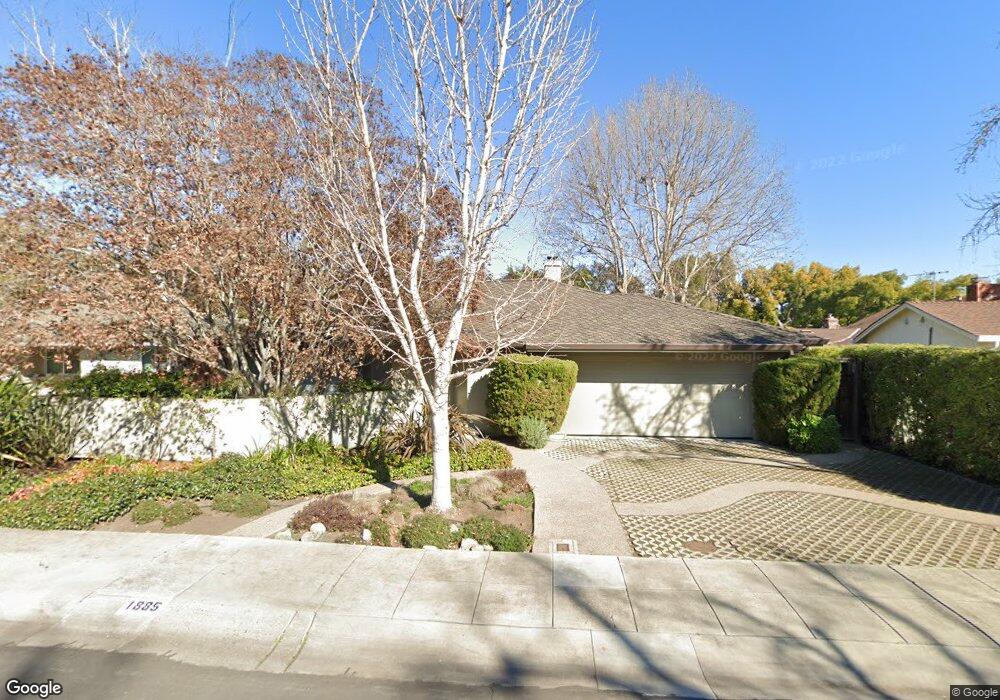
1885 Mark Twain St Palo Alto, CA 94303
Old Palo Alto NeighborhoodEstimated Value: $4,239,112 - $4,864,000
3
Beds
2
Baths
1,714
Sq Ft
$2,593/Sq Ft
Est. Value
About This Home
This home is located at 1885 Mark Twain St, Palo Alto, CA 94303 and is currently estimated at $4,444,278, approximately $2,592 per square foot. 1885 Mark Twain St is a home located in Santa Clara County with nearby schools including Walter Hays Elementary, Frank S. Greene Jr. Middle, and Palo Alto High School.
Ownership History
Date
Name
Owned For
Owner Type
Purchase Details
Closed on
Sep 28, 2016
Sold by
Collet Bette A and Taylor Larry
Bought by
Collet Bette A and Taylor Larry
Current Estimated Value
Purchase Details
Closed on
Nov 8, 2006
Sold by
Collet Robert C
Bought by
Collet Robert C and Collet Bette A
Home Financials for this Owner
Home Financials are based on the most recent Mortgage that was taken out on this home.
Original Mortgage
$1,344,000
Outstanding Balance
$786,820
Interest Rate
6.12%
Mortgage Type
Purchase Money Mortgage
Estimated Equity
$3,657,458
Purchase Details
Closed on
Oct 10, 2006
Sold by
Collet Bette A
Bought by
Collet Robert C
Home Financials for this Owner
Home Financials are based on the most recent Mortgage that was taken out on this home.
Original Mortgage
$1,344,000
Outstanding Balance
$786,820
Interest Rate
6.12%
Mortgage Type
Purchase Money Mortgage
Estimated Equity
$3,657,458
Purchase Details
Closed on
Oct 5, 2006
Sold by
Gradman Marc D and Gradman Elaine R
Bought by
Collet Robert C
Home Financials for this Owner
Home Financials are based on the most recent Mortgage that was taken out on this home.
Original Mortgage
$1,344,000
Outstanding Balance
$786,820
Interest Rate
6.12%
Mortgage Type
Purchase Money Mortgage
Estimated Equity
$3,657,458
Purchase Details
Closed on
Jun 16, 2003
Sold by
Gradman Mark D and Gradman Elaine R
Bought by
Gradman Marc D and Gradman Elaine R
Home Financials for this Owner
Home Financials are based on the most recent Mortgage that was taken out on this home.
Original Mortgage
$650,000
Interest Rate
5.37%
Mortgage Type
Purchase Money Mortgage
Purchase Details
Closed on
Nov 6, 2002
Sold by
Gradman Marc D and Gradman Elaine R
Bought by
Gradman Marc D and Gradman Elaine R
Home Financials for this Owner
Home Financials are based on the most recent Mortgage that was taken out on this home.
Original Mortgage
$417,500
Interest Rate
5.95%
Mortgage Type
Purchase Money Mortgage
Purchase Details
Closed on
May 13, 2002
Sold by
Gradman Marc D and Gradman Elaine R
Bought by
Gradman Marc D and Gradman Elaine R
Home Financials for this Owner
Home Financials are based on the most recent Mortgage that was taken out on this home.
Original Mortgage
$418,500
Interest Rate
6.94%
Purchase Details
Closed on
Oct 6, 1993
Sold by
Gradman Marc D and Gradman Elaine R
Bought by
Gradman Marc D and Gradman Elaine R
Home Financials for this Owner
Home Financials are based on the most recent Mortgage that was taken out on this home.
Original Mortgage
$465,000
Interest Rate
6.94%
Create a Home Valuation Report for This Property
The Home Valuation Report is an in-depth analysis detailing your home's value as well as a comparison with similar homes in the area
Home Values in the Area
Average Home Value in this Area
Purchase History
| Date | Buyer | Sale Price | Title Company |
|---|---|---|---|
| Collet Bette A | -- | None Available | |
| Collet Robert C | -- | None Available | |
| Collet Robert C | -- | Chicago Title Company | |
| Collet Robert C | -- | Chicago Title Company | |
| Gradman Marc D | -- | Chicago Title | |
| Gradman Mark D | -- | Chicago Title | |
| Gradman Marc D | -- | Alliance Title Company | |
| Gradman Marc D | -- | Alliance Title Company | |
| Gradman Marc D | -- | All California Title Company |
Source: Public Records
Mortgage History
| Date | Status | Borrower | Loan Amount |
|---|---|---|---|
| Open | Collet Robert C | $1,344,000 | |
| Previous Owner | Gradman Mark D | $650,000 | |
| Previous Owner | Gradman Marc D | $417,500 | |
| Previous Owner | Gradman Marc D | $418,500 | |
| Previous Owner | Gradman Marc D | $465,000 | |
| Closed | Gradman Mark D | $500,000 |
Source: Public Records
Tax History Compared to Growth
Tax History
| Year | Tax Paid | Tax Assessment Tax Assessment Total Assessment is a certain percentage of the fair market value that is determined by local assessors to be the total taxable value of land and additions on the property. | Land | Improvement |
|---|---|---|---|---|
| 2025 | $36,994 | $3,124,800 | $2,986,594 | $138,206 |
| 2024 | $36,994 | $3,063,531 | $2,928,034 | $135,497 |
| 2023 | $36,451 | $3,003,463 | $2,870,622 | $132,841 |
| 2022 | $36,032 | $2,944,573 | $2,814,336 | $130,237 |
| 2021 | $35,323 | $2,886,837 | $2,759,153 | $127,684 |
| 2020 | $34,590 | $2,857,237 | $2,730,862 | $126,375 |
| 2019 | $34,210 | $2,801,214 | $2,677,316 | $123,898 |
| 2018 | $33,267 | $2,746,289 | $2,624,820 | $121,469 |
| 2017 | $23,799 | $1,939,401 | $1,650,803 | $288,598 |
| 2016 | $23,175 | $1,901,375 | $1,618,435 | $282,940 |
| 2015 | $22,949 | $1,872,815 | $1,594,125 | $278,690 |
| 2014 | $22,474 | $1,836,130 | $1,562,899 | $273,231 |
Source: Public Records
Map
Nearby Homes
- 1711 Guinda St
- 627 Tennyson Ave
- 61 Primrose Way
- 1730 Webster St
- 1827 Cowper St
- 1119 Hopkins Ave
- 161 Primrose Way
- 444 Tennyson Ave
- 836 Warren Way
- 2200 Saint Francis Dr
- 20 Kent Place
- 1218 Middlefield Rd
- 671 Kingsley Ave
- 915 Colonial Ln
- 2590 Webster St
- 1033 Guinda St
- 2399 South Ct
- 535 Kingsley Ave
- 653 Wildwood Ln
- 961 Channing Ave
- 1873 Mark Twain St
- 1884 Bret Harte St
- 1861 Mark Twain St
- 841 Seale Ave
- 1868 Bret Harte St
- 1892 Mark Twain St
- 1880 Mark Twain St
- 821 Seale Ave
- 1852 Bret Harte St
- 1849 Mark Twain St
- 1868 Mark Twain St
- 824 Seale Ave
- 1836 Bret Harte St
- 830 Seale Ave
- 818 Seale Ave
- 1856 Mark Twain St
- 836 Seale Ave
- 1837 Mark Twain St
- 812 Seale Ave
- 1889 Bret Harte St