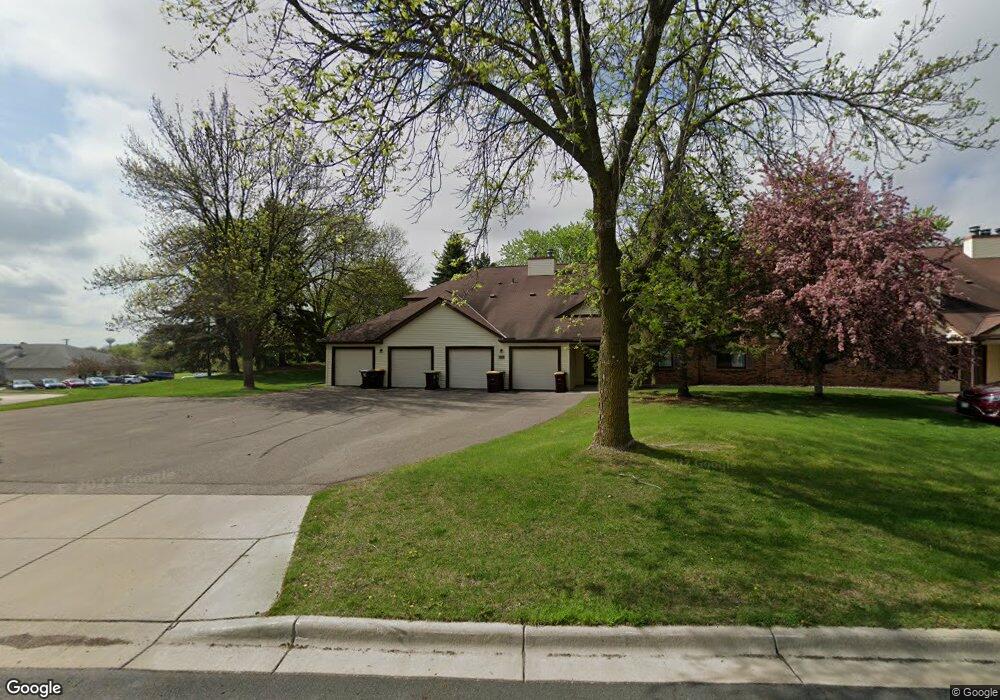
1888 Fox Ridge Dr Unit B Saint Paul, MN 55118
Estimated Value: $181,730 - $217,000
2
Beds
1
Bath
1,000
Sq Ft
$196/Sq Ft
Est. Value
About This Home
This home is located at 1888 Fox Ridge Dr Unit B, Saint Paul, MN 55118 and is currently estimated at $196,433, approximately $196 per square foot. 1888 Fox Ridge Dr Unit B is a home located in Dakota County with nearby schools including Garlough Environmental Magnet, Friendly Hills Middle School, and Two Rivers High School.
Ownership History
Date
Name
Owned For
Owner Type
Purchase Details
Closed on
Dec 14, 2018
Sold by
Merhar Avis and Dunn Laura
Bought by
Anderson Delaine M
Current Estimated Value
Home Financials for this Owner
Home Financials are based on the most recent Mortgage that was taken out on this home.
Original Mortgage
$90,000
Outstanding Balance
$79,450
Interest Rate
4.9%
Mortgage Type
New Conventional
Estimated Equity
$116,983
Purchase Details
Closed on
Sep 24, 2013
Sold by
Merhar Avis
Bought by
Merhar Avis and Dunn Laura
Purchase Details
Closed on
Feb 18, 2011
Sold by
Sessions Susan A and Sessions John S
Bought by
Merhar Avis
Purchase Details
Closed on
Dec 30, 2004
Sold by
Hagland Arlene J
Bought by
Arndt Lloyd
Purchase Details
Closed on
Aug 25, 2003
Sold by
Ross Thomas E and Ross Patricia A
Bought by
Unavailable
Create a Home Valuation Report for This Property
The Home Valuation Report is an in-depth analysis detailing your home's value as well as a comparison with similar homes in the area
Home Values in the Area
Average Home Value in this Area
Purchase History
| Date | Buyer | Sale Price | Title Company |
|---|---|---|---|
| Anderson Delaine M | $145,000 | Partners Title Llc | |
| Merhar Avis | -- | Title Recording Services | |
| Merhar Avis | $79,951 | Title Recording Services | |
| Merhar Avis | $79,950 | -- | |
| Arndt Lloyd | $148,000 | -- | |
| Unavailable | $141,900 | -- |
Source: Public Records
Mortgage History
| Date | Status | Borrower | Loan Amount |
|---|---|---|---|
| Open | Anderson Delaine M | $90,000 |
Source: Public Records
Tax History Compared to Growth
Tax History
| Year | Tax Paid | Tax Assessment Tax Assessment Total Assessment is a certain percentage of the fair market value that is determined by local assessors to be the total taxable value of land and additions on the property. | Land | Improvement |
|---|---|---|---|---|
| 2024 | $2,044 | $177,800 | $17,500 | $160,300 |
| 2023 | $2,044 | $182,800 | $18,000 | $164,800 |
| 2022 | $1,662 | $161,100 | $15,900 | $145,200 |
| 2021 | $1,572 | $147,400 | $14,500 | $132,900 |
| 2020 | $1,462 | $140,100 | $13,800 | $126,300 |
| 2019 | $1,595 | $129,300 | $12,700 | $116,600 |
| 2018 | $1,234 | $124,600 | $12,500 | $112,100 |
| 2017 | $926 | $104,300 | $10,400 | $93,900 |
| 2016 | $824 | $89,800 | $9,000 | $80,800 |
| 2015 | $779 | $51,050 | $5,105 | $45,945 |
| 2014 | -- | $48,434 | $4,868 | $43,566 |
| 2013 | -- | $40,980 | $4,080 | $36,900 |
Source: Public Records
Map
Nearby Homes
- 1923 Fox Ridge Dr Unit B
- 8XX Humboldt Ave
- 25 W Kraft Rd
- 1701 Livingston Ave Unit B
- 1694 Humboldt Ave
- 2012 Pine Ridge Dr
- 180 Wentworth Ave W Unit D
- 170 Wentworth Ave W Unit F
- 48 Thompson Ave W Unit 40
- 1620 Charlton St Unit 109
- 1450 Bidwell St Unit 110
- Bayfield Plan at Thompson Square East
- Capri Plan at Thompson Square East
- 1531 Traverse Ln
- Hayward Plan at Thompson Square East
- Barcelona Plan at Thompson Square East
- Athens II Plan at Thompson Square East
- Athens Plan at Thompson Square East
- 1526 Traverse Ln
- 1518 Traverse Ln
- 1890 Fox Ridge Dr Unit A
- 1890 Fox Ridge Dr Unit 808A
- 1890 Fox Ridge Dr Unit 807D
- 1890 Fox Ridge Dr Unit 806B
- 1890 Fox Ridge Dr Unit 805C
- 1888 Fox Ridge Dr Unit 804B
- 1888 Fox Ridge Dr Unit 803C
- 1888 Fox Ridge Dr Unit 802A
- 1888 Fox Ridge Dr Unit 801D
- 1888 1888 Fox Ridge Dr
- 1888 Fox Ridge Dr Unit C
- 1888 Fox Ridge Dr Unit D
- 1888 Fox Ridge Dr Unit A
- 1890 Fox Ridge Dr Unit D
- 1890 1890 Fox Ridge Dr
- 1936 Fox Ridge Dr Unit D
- 1936 Fox Ridge Dr Unit 908A
- 1936 Fox Ridge Dr Unit 907D
- 1936 Fox Ridge Dr Unit 906B
- 1936 Fox Ridge Dr Unit 905C