


189 Elm Ln Rabun Gap, GA 30568
Estimated payment $1,672/month
Highlights
- Private Waterfront
- Deck
- Ranch Style House
- Community Lake
- Wood Burning Stove
- Solid Surface Countertops
About This Home
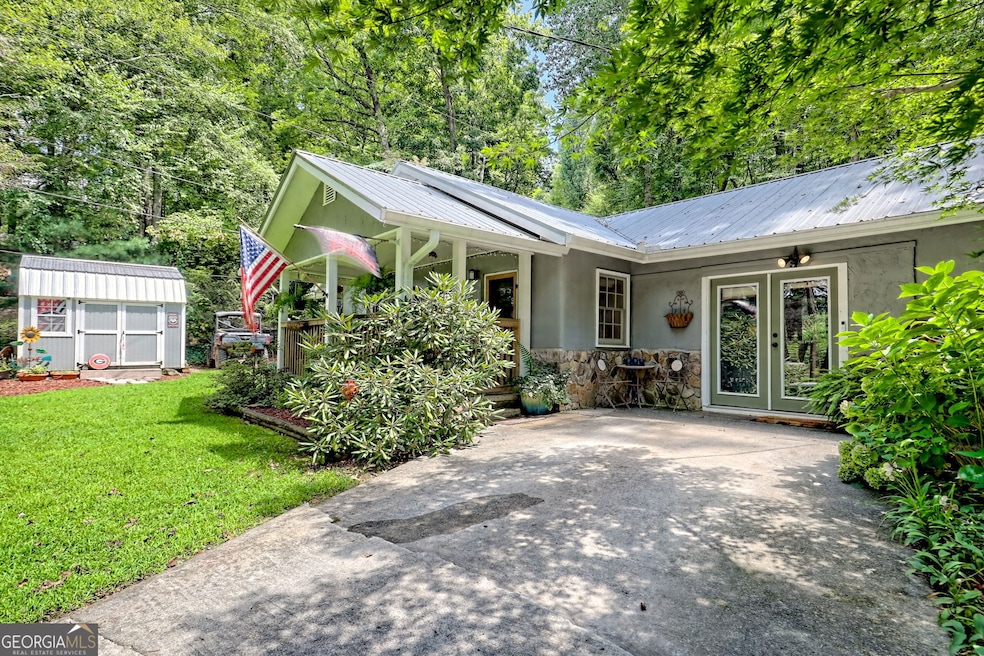
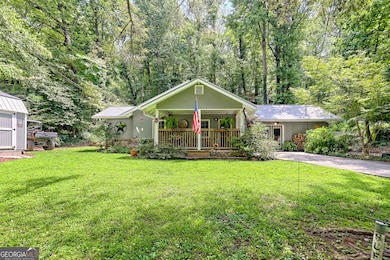
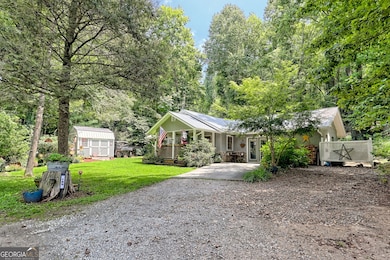
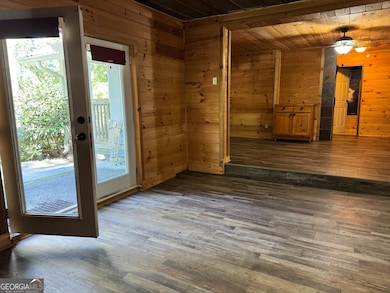
Escape to the Northeast Georgia Mountains with this charming 2 bedroom, 2 bathroom home tucked away in the Sylvan Lake Falls Community in Rabun Gap, GA. Surrounded by peaceful forest views and cool mountain breezes resting high at 2700 feet in elevation, this cozy retreat offers a step-less entry home with a small flat front yard with a covered porch perfect for sipping coffee and an amazing private back deck area surrounded by mature landscaping where you can unwind and relax and watch your favorite football team this Fall. Inside, you will find a large living area equipped with a masonry wood burning stove and a quaint country kitchen. New shed outside conveys with property for extra storage. Sellers have upgraded electrical throughout the home, purchased a brand new water heater with 6 year warranty and installed brand new windows in the laundry room. Metal Roof is less than 5 years old. This home is tucked into a quiet, established community with access to a private lake-offering a peaceful spot to fish, kayak, or unwind. Located less than 15 minutes from downtown Clayton, with nearby access to Black Rock State Park and the lake, this home makes it easy to balance peaceful seclusion with outdoor adventure. Whether you're looking for a full-time home or a relaxing mountain retreat, this property is ready to welcome you.
Home Details
Home Type
- Single Family
Est. Annual Taxes
- $1,216
Year Built
- Built in 1977
Lot Details
- 0.37 Acre Lot
- Private Waterfront
- Lake Front
- Level Lot
HOA Fees
- $69 Monthly HOA Fees
Home Design
- Ranch Style House
- Bungalow
- Metal Roof
- Concrete Siding
- Stone Siding
- Stone
Interior Spaces
- 1,347 Sq Ft Home
- Wood Burning Stove
- Fireplace Features Masonry
- Living Room with Fireplace
- Laundry closet
Kitchen
- Country Kitchen
- Oven or Range
- Cooktop
- Microwave
- Dishwasher
- Solid Surface Countertops
Flooring
- Tile
- Vinyl
Bedrooms and Bathrooms
- 2 Main Level Bedrooms
- 2 Full Bathrooms
Parking
- 3 Parking Spaces
- Parking Pad
- Parking Accessed On Kitchen Level
Accessible Home Design
- Accessible Entrance
Outdoor Features
- No Dock Rights
- Deck
- Patio
- Shed
- Outbuilding
- Porch
Schools
- Rabun County Primary/Elementar Elementary School
- Rabun County Middle School
- Rabun County High School
Utilities
- Central Air
- Heating System Uses Wood
- Private Water Source
- Well
- Tankless Water Heater
- Septic Tank
- High Speed Internet
- Cable TV Available
Community Details
- $75 Initiation Fee
- Association fees include private roads, water
- Sylvan Lake Falls Subdivision
- Community Lake
Listing and Financial Details
- Tax Lot 8
Map
Home Values in the Area
Average Home Value in this Area
Tax History
| Year | Tax Paid | Tax Assessment Tax Assessment Total Assessment is a certain percentage of the fair market value that is determined by local assessors to be the total taxable value of land and additions on the property. | Land | Improvement |
|---|---|---|---|---|
| 2024 | $1,216 | $75,735 | $15,000 | $60,735 |
| 2023 | $1,255 | $68,573 | $15,000 | $53,573 |
| 2022 | $1,174 | $64,164 | $12,500 | $51,664 |
| 2021 | $1,087 | $57,958 | $12,500 | $45,458 |
| 2020 | $741 | $38,191 | $12,500 | $25,691 |
| 2019 | $746 | $38,191 | $12,500 | $25,691 |
| 2018 | $749 | $38,191 | $12,500 | $25,691 |
| 2017 | $720 | $38,191 | $12,500 | $25,691 |
| 2016 | $720 | $38,191 | $12,500 | $25,691 |
| 2015 | $721 | $37,431 | $12,500 | $24,931 |
| 2014 | $725 | $37,431 | $12,500 | $24,931 |
Property History
| Date | Event | Price | List to Sale | Price per Sq Ft |
|---|---|---|---|---|
| 10/25/2025 10/25/25 | Price Changed | $285,000 | -5.0% | $212 / Sq Ft |
| 09/29/2025 09/29/25 | Price Changed | $300,000 | 0.0% | $223 / Sq Ft |
| 09/29/2025 09/29/25 | For Sale | $300,000 | +1.7% | $223 / Sq Ft |
| 09/15/2025 09/15/25 | Off Market | $295,000 | -- | -- |
| 08/22/2025 08/22/25 | For Sale | $295,000 | -- | $219 / Sq Ft |
Purchase History
| Date | Type | Sale Price | Title Company |
|---|---|---|---|
| Warranty Deed | $185,000 | -- | |
| Warranty Deed | $185,000 | -- | |
| Deed | $79,000 | -- | |
| Deed | $79,000 | -- | |
| Warranty Deed | $29,500 | -- | |
| Warranty Deed | $29,500 | -- | |
| Warranty Deed | $13,000 | -- | |
| Warranty Deed | $13,000 | -- | |
| Warranty Deed | -- | -- | |
| Warranty Deed | -- | -- |
Mortgage History
| Date | Status | Loan Amount | Loan Type |
|---|---|---|---|
| Open | $138,750 | New Conventional | |
| Closed | $138,750 | New Conventional | |
| Previous Owner | $121,600 | New Conventional |
Source: Georgia MLS
MLS Number: 10589352
APN: 041A-125
Disclaimer: Certain information contained herein is derived from information provided by parties other than Homes.com. All information provided is deemed reliable, but is not guaranteed to be accurate and should be independently verified.
![]() The data relating to real estate for sale on this web site comes in part from the Broker Reciprocity Program of Georgia MLS. Real estate listings held by brokerage firms other than Redfin are marked with the Broker Reciprocity logo and detailed information about them includes the name of the listing brokers. Information deemed reliable but not guaranteed. Copyright 2025 Georgia MLS. All rights reserved.
The data relating to real estate for sale on this web site comes in part from the Broker Reciprocity Program of Georgia MLS. Real estate listings held by brokerage firms other than Redfin are marked with the Broker Reciprocity logo and detailed information about them includes the name of the listing brokers. Information deemed reliable but not guaranteed. Copyright 2025 Georgia MLS. All rights reserved.
- 108 Elm Ln
- 0 Alto Ln Unit 10533235
- 0 Pitts Way Unit 10592369
- 0 Crest Ln Unit LOT 5 10572844
- 0 Sylvan Lake Dr Unit 47,48 10485897
- 0 Black Rock Estates Unit 25 10374676
- 0 Forest Canopy Way Unit 11
- 784 Wolffork Church Rd
- 1422 Wolffork Rd
- 153 Coleman Heights Ln
- 548 Black Rock Mountain Pkwy
- 120 Maple Springs Ln
- 36 Maple Springs Ln
- 5019 Wolffork Rd
- 52 Lucky Ln
- 5192 Wolffork Rd
- 5345 Wolffork Rd
- 994 Winding View Trail
- 0 Green St Unit 10565711
- 416 Winding View Trail
- 160 Marsen Knob Dr
- 21 Switchback
- 74 Lockerbie Ct Unit 202
- 173 Payne Hill Dr
- 104 Travelers Ln
- 441 Dunlap St
- 527 Mountainside Dr
- 96 Saddle Gap Dr
- 239 Shakespeare Dr
- 103 Bent Grass Way
- 21 Staghorn Point
- 35 Misty Meadow Ln
- 966 Gibson Rd
- 72 Golfview Dr
- 210 Lake Becky Rd
- 85 Maple St
- 103C Willow View Dr
- 170 Hawks Ridge Creekside Dr
- 778 N Main St
- 1056 Sky Hawk Mountain Rd
