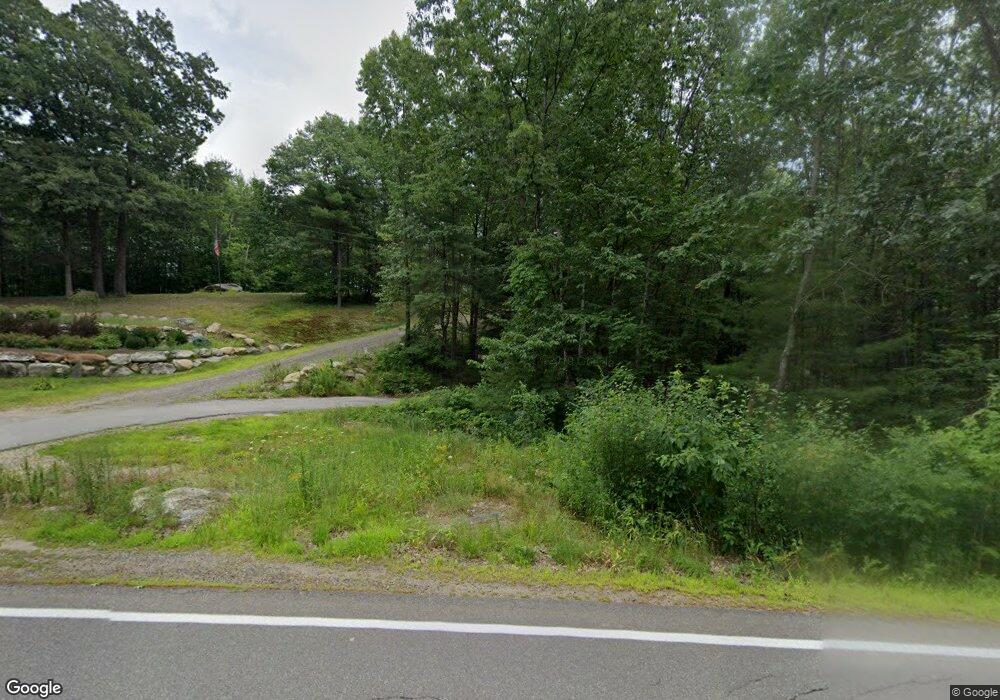
189 Elm St Concord, NH 03303
Penacook NeighborhoodEstimated Value: $545,000 - $693,666
3
Beds
3
Baths
2,121
Sq Ft
$281/Sq Ft
Est. Value
About This Home
This home is located at 189 Elm St, Concord, NH 03303 and is currently estimated at $596,667, approximately $281 per square foot. 189 Elm St is a home located in Merrimack County with nearby schools including Penacook Elementary School, Merrimack Valley Middle School, and Merrimack Valley High School.
Ownership History
Date
Name
Owned For
Owner Type
Purchase Details
Closed on
May 10, 2024
Sold by
Johnston Angela S
Bought by
Angela S Johnston Ret and Johnston
Current Estimated Value
Purchase Details
Closed on
Jun 15, 2020
Sold by
Johnston Angela and Johnston Mark E
Bought by
Johnston Angela S
Create a Home Valuation Report for This Property
The Home Valuation Report is an in-depth analysis detailing your home's value as well as a comparison with similar homes in the area
Home Values in the Area
Average Home Value in this Area
Purchase History
| Date | Buyer | Sale Price | Title Company |
|---|---|---|---|
| Angela S Johnston Ret | -- | None Available | |
| Angela S Johnston Ret | -- | None Available | |
| Johnston Angela S | -- | None Available | |
| Johnston Angela S | -- | None Available |
Source: Public Records
Tax History Compared to Growth
Tax History
| Year | Tax Paid | Tax Assessment Tax Assessment Total Assessment is a certain percentage of the fair market value that is determined by local assessors to be the total taxable value of land and additions on the property. | Land | Improvement |
|---|---|---|---|---|
| 2024 | $15,026 | $490,400 | $178,100 | $312,300 |
| 2023 | $14,295 | $490,400 | $178,100 | $312,300 |
| 2022 | $14,285 | $490,400 | $178,100 | $312,300 |
| 2021 | $12,142 | $434,100 | $121,800 | $312,300 |
| 2020 | $12,014 | $401,400 | $93,200 | $308,200 |
| 2019 | $12,661 | $371,300 | $90,100 | $281,200 |
| 2018 | $11,982 | $356,600 | $90,100 | $266,500 |
| 2017 | $11,611 | $342,300 | $85,600 | $256,700 |
| 2016 | $9,007 | $325,500 | $82,900 | $242,600 |
| 2015 | $10,581 | $313,000 | $82,900 | $230,100 |
| 2014 | $10,138 | $313,000 | $82,900 | $230,100 |
| 2013 | -- | $308,500 | $82,900 | $225,600 |
| 2012 | -- | $313,400 | $82,900 | $230,500 |
Source: Public Records
Map
Nearby Homes
- 50 Weir Rd
- 130 Borough Rd
- 29 Whitewater Dr
- 100 Elm St Unit 26
- 36 Whitewater Dr
- 20 Millstream Ln
- 20 Bentwood St
- 33 Tanner St
- 79 Primrose Ln
- 166 Village St
- 105 Lilac St
- 48 Community Dr
- 26 Crescent St
- 12 Cross St Unit 201
- 10 Jackson St
- 4A Villa Brasi Ln
- 4B Villa Brasi Ln
- 2B Villa Brasi Ln
- 6A Villa Brasi Ln
- 5 Gage St