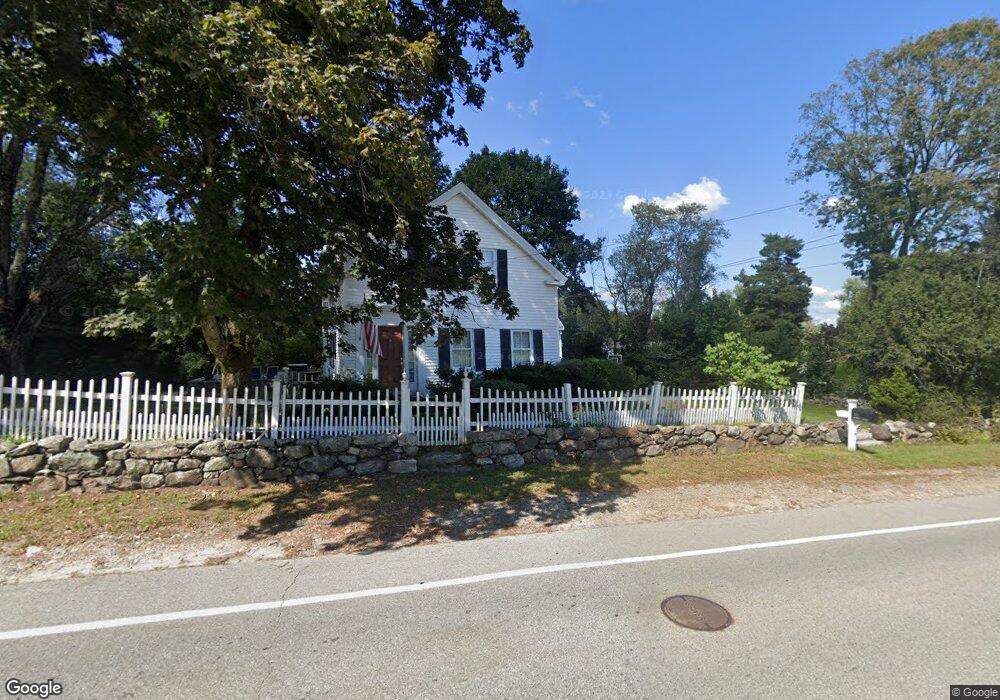
189 Lowell St Andover, MA 01810
West Andover NeighborhoodEstimated Value: $671,000 - $1,231,000
3
Beds
2
Baths
2,377
Sq Ft
$387/Sq Ft
Est. Value
About This Home
This home is located at 189 Lowell St, Andover, MA 01810 and is currently estimated at $920,750, approximately $387 per square foot. 189 Lowell St is a home located in Essex County with nearby schools including West Elementary School, Andover West Middle School, and Andover High School.
Ownership History
Date
Name
Owned For
Owner Type
Purchase Details
Closed on
Dec 18, 1998
Sold by
Contemporary Bldrs Inc
Bought by
Byers Robert M and Haskell Catherine G
Current Estimated Value
Purchase Details
Closed on
Jan 12, 1998
Sold by
Hill Palma T
Bought by
Contemporary Bldrs Inc
Create a Home Valuation Report for This Property
The Home Valuation Report is an in-depth analysis detailing your home's value as well as a comparison with similar homes in the area
Home Values in the Area
Average Home Value in this Area
Purchase History
| Date | Buyer | Sale Price | Title Company |
|---|---|---|---|
| Byers Robert M | $310,000 | -- | |
| Byers Robert M | $310,000 | -- | |
| Contemporary Bldrs Inc | $180,000 | -- | |
| Contemporary Bldrs Inc | $180,000 | -- |
Source: Public Records
Mortgage History
| Date | Status | Borrower | Loan Amount |
|---|---|---|---|
| Open | Contemporary Bldrs Inc | $265,850 | |
| Closed | Contemporary Bldrs Inc | $230,818 |
Source: Public Records
Tax History
| Year | Tax Paid | Tax Assessment Tax Assessment Total Assessment is a certain percentage of the fair market value that is determined by local assessors to be the total taxable value of land and additions on the property. | Land | Improvement |
|---|---|---|---|---|
| 2024 | $11,457 | $889,500 | $416,500 | $473,000 |
| 2023 | $11,078 | $811,000 | $385,600 | $425,400 |
| 2022 | $10,419 | $713,600 | $326,600 | $387,000 |
| 2021 | $9,955 | $651,100 | $296,900 | $354,200 |
| 2020 | $9,545 | $635,900 | $289,700 | $346,200 |
| 2019 | $9,440 | $618,200 | $281,300 | $336,900 |
| 2018 | $8,974 | $573,800 | $265,200 | $308,600 |
| 2017 | $8,589 | $565,800 | $260,000 | $305,800 |
| 2016 | $8,385 | $565,800 | $260,000 | $305,800 |
| 2015 | $8,048 | $537,600 | $250,000 | $287,600 |
Source: Public Records
Map
Nearby Homes
- 37 Crenshaw Ln Unit 37
- 241 Lowell St Unit 3
- 25 Clubview Dr Unit 25
- 21 Clubview Dr Unit 21
- 22 Railroad St Unit 407
- 2 Powder Mill Square Unit 2B
- 50C Washington Park Dr Unit 10
- 105 Central St
- 5 Lewis St
- 354 N Main St Unit 214
- 16 Balmoral St Unit 214
- 67 High St
- 5 Weeping Willow Dr
- Lot 7 Weeping Willow Dr
- 3 Torr St
- 96 Beacon St
- 42 York St
- 9 Oakland Rd
- 0
- 20-22 Florence St