Estimated Value: $537,668 - $559,000
5
Beds
6
Baths
2,324
Sq Ft
$237/Sq Ft
Est. Value
About This Home
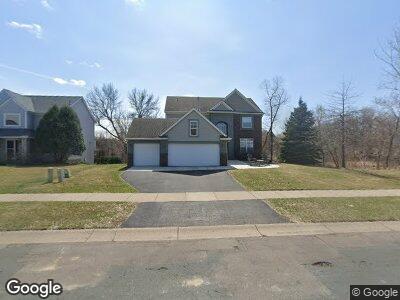
This home is located at 18917 95th Ave N, Osseo, MN 55311 and is currently estimated at $549,917, approximately $236 per square foot. 18917 95th Ave N is a home located in Hennepin County with nearby schools including Rush Creek Elementary School, Maple Grove Middle School, and Maple Grove Senior High School.
Ownership History
Date
Name
Owned For
Owner Type
Purchase Details
Closed on
Oct 6, 2023
Sold by
Mankey Mark J and Mankey Heidi H
Bought by
Mark J Mankey Revocable Living Trust and Mankey
Current Estimated Value
Purchase Details
Closed on
Aug 27, 2015
Sold by
Wolf Albert A and Wolf Karen K
Bought by
Mankey Mark and Mankey Heidi
Home Financials for this Owner
Home Financials are based on the most recent Mortgage that was taken out on this home.
Original Mortgage
$171,000
Interest Rate
3.75%
Mortgage Type
New Conventional
Purchase Details
Closed on
Dec 6, 2007
Sold by
Neale Robert G and Neale Michele B
Bought by
Mankey Mark and Mankey Heidi
Purchase Details
Closed on
Sep 20, 1997
Sold by
The Rootlund Company Inc
Bought by
Liv James W and Liv Lorraine I Neale Revocable
Purchase Details
Closed on
Jul 31, 1997
Sold by
Tradition Ventures Llc
Bought by
The Rottlund Company Inc
Create a Home Valuation Report for This Property
The Home Valuation Report is an in-depth analysis detailing your home's value as well as a comparison with similar homes in the area
Home Values in the Area
Average Home Value in this Area
Purchase History
| Date | Buyer | Sale Price | Title Company |
|---|---|---|---|
| Mark J Mankey Revocable Living Trust | $500 | None Listed On Document | |
| Mankey Mark | -- | Attorney | |
| Mankey Mark | -- | None Available | |
| Mankey Mark | $339,000 | -- | |
| Liv James W | $209,642 | -- | |
| The Rottlund Company Inc | $13,800 | -- |
Source: Public Records
Mortgage History
| Date | Status | Borrower | Loan Amount |
|---|---|---|---|
| Previous Owner | Mankey Mark | $190,000 | |
| Previous Owner | Mankey Mark | $171,000 | |
| Previous Owner | Mankey Mark J | $160,000 | |
| Previous Owner | Neale Robert G | $420,000 | |
| Previous Owner | Neale Robert G | $30,000 |
Source: Public Records
Tax History Compared to Growth
Tax History
| Year | Tax Paid | Tax Assessment Tax Assessment Total Assessment is a certain percentage of the fair market value that is determined by local assessors to be the total taxable value of land and additions on the property. | Land | Improvement |
|---|---|---|---|---|
| 2023 | $6,084 | $515,700 | $122,300 | $393,400 |
| 2022 | $5,100 | $494,000 | $92,300 | $401,700 |
| 2021 | $4,998 | $420,200 | $79,900 | $340,300 |
| 2020 | $5,182 | $405,500 | $73,400 | $332,100 |
| 2019 | $5,185 | $399,700 | $81,600 | $318,100 |
| 2018 | $5,194 | $379,000 | $79,300 | $299,700 |
| 2017 | $5,256 | $362,600 | $91,000 | $271,600 |
| 2016 | $5,185 | $353,400 | $91,000 | $262,400 |
| 2015 | $5,129 | $341,100 | $86,000 | $255,100 |
| 2014 | -- | $296,800 | $66,000 | $230,800 |
Source: Public Records
Map
Nearby Homes
- 9567 Alvarado Ln N
- 9694 Winslow Chase N
- 18869 97th Place N
- 18602 97th Place N
- 9179 Larkspur Glade
- 18690 97th Place N
- 18061 96th Ave N
- 18049 96th Ave N
- 18534 98th Place N
- 9001 Sawgrass Glen
- 9020 Tewsbury Gate
- 9885 Troy Ln N
- 8947 Vandegriff Way
- 19253 99th Place
- 9640 Peony Ln N Unit 1208
- 8941 Vandegriff Way
- 19029 100th Place N
- 8924 Tewsbury Gate N
- 19086 100th Place N
- 19510 103rd Ave
- 18917 95th Ave N
- 18905 95th Ave N
- 18912 18912 95th-Avenue-n
- 18890 18890 95th-Avenue-n
- 18883 95th Ave N
- 18960 18960 95th-Avenue-n
- 18924 95th Ave N
- 18912 95th Ave N
- 18936 95th Ave N
- 18861 95th Ave N
- 18948 95th Ave N
- 18890 95th Ave N
- 18960 95th Ave N
- 18878 95th Ave N
- 19029 95th Ave N
- 18849 95th Ave N
- 18836 95th Ave N
- 9514 Alvarado Ln N
- 9450 Brockton Ln N
- 19041 95th Ave N