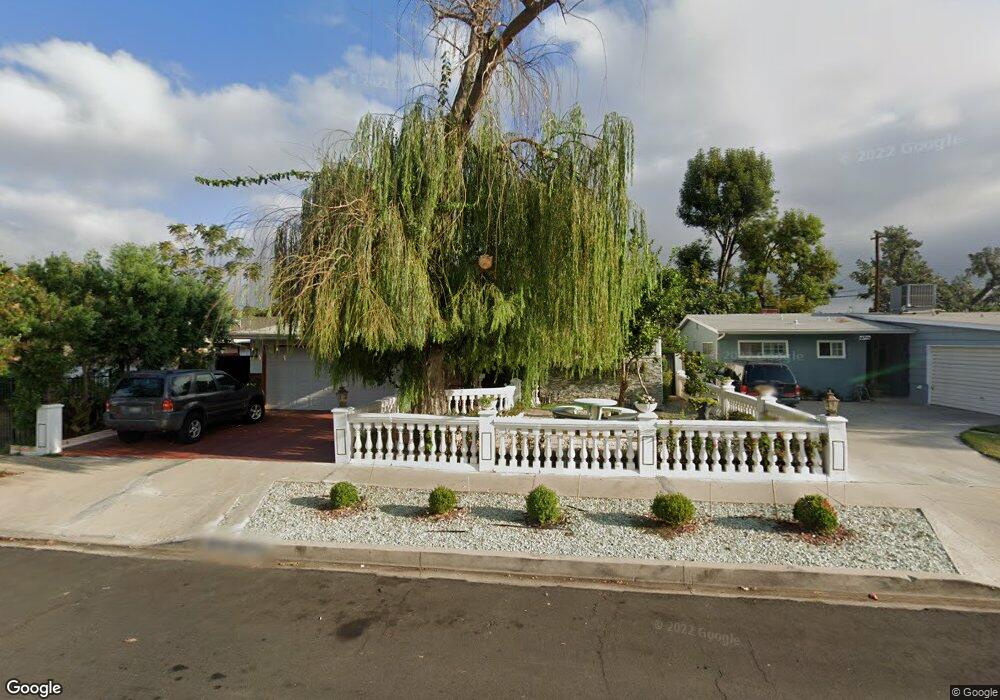
18935 Vose St Reseda, CA 91335
Estimated Value: $797,498 - $856,000
3
Beds
2
Baths
1,487
Sq Ft
$562/Sq Ft
Est. Value
About This Home
This home is located at 18935 Vose St, Reseda, CA 91335 and is currently estimated at $836,375, approximately $562 per square foot. 18935 Vose St is a home located in Los Angeles County with nearby schools including Shirley Avenue Elementary School, John A. Sutter Middle School, and Magnolia Science Academy.
Ownership History
Date
Name
Owned For
Owner Type
Purchase Details
Closed on
Jan 30, 2010
Sold by
Riazati Nasim
Bought by
Riazati Nasim
Current Estimated Value
Purchase Details
Closed on
Jun 5, 2001
Sold by
Caefer Wes
Bought by
Riazati Nasim
Home Financials for this Owner
Home Financials are based on the most recent Mortgage that was taken out on this home.
Original Mortgage
$191,700
Outstanding Balance
$73,022
Interest Rate
7.14%
Estimated Equity
$763,353
Purchase Details
Closed on
Dec 18, 2000
Sold by
Kellogg Karen J
Bought by
Caefer Wes and Caefer Aida
Home Financials for this Owner
Home Financials are based on the most recent Mortgage that was taken out on this home.
Original Mortgage
$164,700
Interest Rate
7.54%
Purchase Details
Closed on
Oct 2, 2000
Sold by
Kapsalla John
Bought by
Kapsalla John and The John Kapsalla Living Trust
Create a Home Valuation Report for This Property
The Home Valuation Report is an in-depth analysis detailing your home's value as well as a comparison with similar homes in the area
Home Values in the Area
Average Home Value in this Area
Purchase History
| Date | Buyer | Sale Price | Title Company |
|---|---|---|---|
| Riazati Nasim | -- | None Available | |
| Riazati Nasim | $213,000 | Investors Title Company | |
| Caefer Wes | $183,000 | Southland Title | |
| Kapsalla John | -- | Stewart Title |
Source: Public Records
Mortgage History
| Date | Status | Borrower | Loan Amount |
|---|---|---|---|
| Open | Riazati Nasim | $191,700 | |
| Previous Owner | Caefer Wes | $164,700 |
Source: Public Records
Tax History Compared to Growth
Tax History
| Year | Tax Paid | Tax Assessment Tax Assessment Total Assessment is a certain percentage of the fair market value that is determined by local assessors to be the total taxable value of land and additions on the property. | Land | Improvement |
|---|---|---|---|---|
| 2025 | $3,954 | $314,642 | $219,220 | $95,422 |
| 2024 | $3,954 | $308,473 | $214,922 | $93,551 |
| 2023 | $3,881 | $302,425 | $210,708 | $91,717 |
| 2022 | $3,703 | $296,496 | $206,577 | $89,919 |
| 2021 | $3,653 | $290,683 | $202,527 | $88,156 |
| 2019 | $3,546 | $282,064 | $196,521 | $85,543 |
| 2018 | $3,471 | $276,534 | $192,668 | $83,866 |
| 2016 | $3,305 | $265,798 | $185,188 | $80,610 |
| 2015 | $3,258 | $261,807 | $182,407 | $79,400 |
| 2014 | $3,276 | $256,679 | $178,834 | $77,845 |
Source: Public Records
Map
Nearby Homes
- 18987 Gault St
- 18958 Sherman Way Unit 19
- 19017 Gault St Unit 103
- 18935 Hart St
- 19009 Sherman Way Unit 22
- 19009 Sherman Way Unit 2
- 19103 Sherman Way
- 7315 Ariel Ave
- 6846 Wystone Ave
- 7127 Yolanda Ave
- 6908 Geyser Ave
- 6918 Claire Ave
- 6545 6545 Reseda
- 7252 Rhea Ave
- 7326 Vanalden Ave
- 19001 Vanowen St
- 19017 Vanowen St
- 7300 Sylvia Ave
- 7131 Baird Ave
- 6958 Amigo Ave