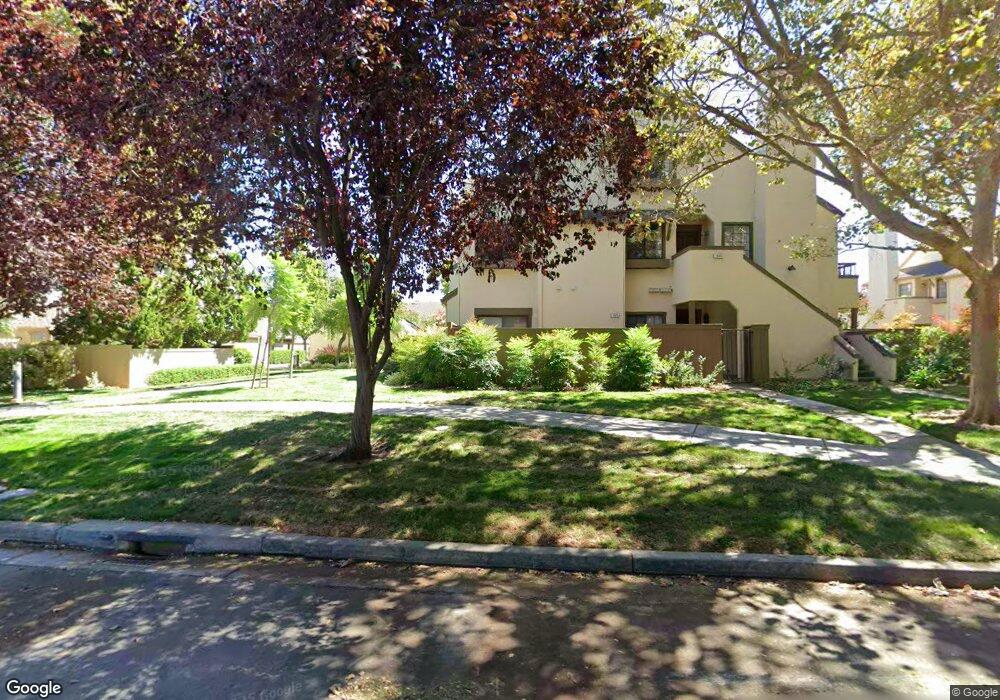
1896 Huxley Ct San Jose, CA 95125
Willow Glen NeighborhoodEstimated Value: $782,028 - $917,000
2
Beds
2
Baths
1,004
Sq Ft
$849/Sq Ft
Est. Value
About This Home
This home is located at 1896 Huxley Ct, San Jose, CA 95125 and is currently estimated at $852,507, approximately $849 per square foot. 1896 Huxley Ct is a home located in Santa Clara County with nearby schools including Del Mar High School, Blackford Elementary, and Sherman Oaks Elementary School.
Ownership History
Date
Name
Owned For
Owner Type
Purchase Details
Closed on
Feb 2, 2023
Sold by
Ocallaghan Christopher A
Bought by
Christopher Ocallaghan And Kessawan Lelanapha
Current Estimated Value
Purchase Details
Closed on
Jan 11, 2000
Sold by
Bonne Frances G and O Callaghan Christopher A
Bought by
Ocallaghan Christopher A
Purchase Details
Closed on
Dec 6, 1999
Sold by
O Callaghan Christopher A
Bought by
Bonne Frances G and Ocallaghan Christopher A
Purchase Details
Closed on
Dec 2, 1999
Sold by
Bonne Frances G
Bought by
Ocallaghan Christopher A
Purchase Details
Closed on
Jul 23, 1998
Sold by
Bonne Frances G
Bought by
Bonne Frances G and Ocallaghan Christopher A
Purchase Details
Closed on
Nov 12, 1997
Sold by
Vicki Groom and Vicki Michael P
Bought by
Bonne Frances G
Home Financials for this Owner
Home Financials are based on the most recent Mortgage that was taken out on this home.
Original Mortgage
$110,000
Interest Rate
7.3%
Create a Home Valuation Report for This Property
The Home Valuation Report is an in-depth analysis detailing your home's value as well as a comparison with similar homes in the area
Home Values in the Area
Average Home Value in this Area
Purchase History
| Date | Buyer | Sale Price | Title Company |
|---|---|---|---|
| Christopher Ocallaghan And Kessawan Lelanapha | -- | -- | |
| Ocallaghan Christopher A | -- | -- | |
| Bonne Frances G | -- | -- | |
| Ocallaghan Christopher A | -- | -- | |
| Bonne Frances G | -- | -- | |
| Bonne Frances G | $210,000 | Commonwealth Land Title Co |
Source: Public Records
Mortgage History
| Date | Status | Borrower | Loan Amount |
|---|---|---|---|
| Previous Owner | Bonne Frances G | $110,000 |
Source: Public Records
Tax History Compared to Growth
Tax History
| Year | Tax Paid | Tax Assessment Tax Assessment Total Assessment is a certain percentage of the fair market value that is determined by local assessors to be the total taxable value of land and additions on the property. | Land | Improvement |
|---|---|---|---|---|
| 2025 | $5,856 | $441,090 | $307,388 | $133,702 |
| 2024 | $5,856 | $432,442 | $301,361 | $131,081 |
| 2023 | $5,747 | $423,963 | $295,452 | $128,511 |
| 2022 | $5,754 | $415,651 | $289,659 | $125,992 |
| 2021 | $5,654 | $407,502 | $283,980 | $123,522 |
| 2020 | $5,543 | $403,325 | $281,069 | $122,256 |
| 2019 | $5,490 | $395,417 | $275,558 | $119,859 |
| 2018 | $5,348 | $387,664 | $270,155 | $117,509 |
| 2017 | $5,284 | $380,063 | $264,858 | $115,205 |
| 2016 | $4,986 | $372,612 | $259,665 | $112,947 |
| 2015 | $4,914 | $367,016 | $255,765 | $111,251 |
| 2014 | $4,703 | $359,827 | $250,755 | $109,072 |
Source: Public Records
Map
Nearby Homes
- 1874 Huxley Ct
- 1932 Huxley Ct
- 1831 Ashmeade Ct
- 1721 Braddock Ct
- 1751 Braddock Ct
- 1990 Southwest Expy
- 2043 Sonador Commons
- 2067 Sonador Commons
- 1405 Allegado Alley Unit 86
- 90 Quail Hollow Dr Unit 90
- 1566 Stokes St
- 177 Quail Hollow Dr Unit 117
- 1182 Leigh Ave
- 1515 Rhinecliff Way
- 26 Quail Hollow Dr Unit 26
- 1492 Aurelian Ln
- 138 Quail Hollow Dr Unit 138
- 1445 S Bascom Ave Unit 47
- 1785 Santa Barbara Dr
- 160 Quail Hollow Dr Unit 160A
- 1895 Huxley Ct
- 1887 Huxley Ct Unit 460
- 1888 Huxley Ct
- 1894 Huxley Ct
- 1886 Huxley Ct Unit 462
- 1889 Huxley Ct
- 1893 Huxley Ct
- 1890 Huxley Ct
- 1904 Huxley Ct Unit 449
- 1903 Huxley Ct
- 1905 Huxley Ct
- 1901 Huxley Ct
- 1898 Huxley Ct Unit 446
- 1884 Huxley Ct
- 1899 Huxley Ct Unit 443
- 1885 Huxley Ct
- 1897 Huxley Ct
- 1902 Huxley Ct Unit 447
- 1891 Huxley Ct Unit 451
- 2006 Foxhall Loop Unit 362