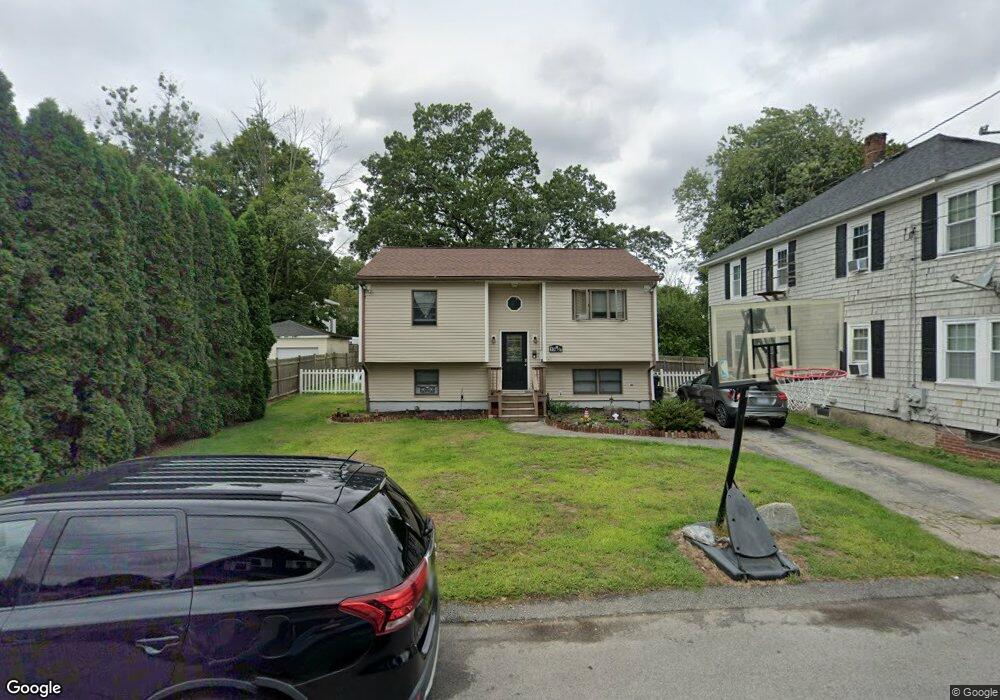
19 1/2 Lenox Ave West Warwick, RI 02893
Centreville NeighborhoodEstimated Value: $369,000 - $415,000
4
Beds
2
Baths
1,480
Sq Ft
$261/Sq Ft
Est. Value
About This Home
This home is located at 19 1/2 Lenox Ave, West Warwick, RI 02893 and is currently estimated at $386,880, approximately $261 per square foot. 19 1/2 Lenox Ave is a home located in Kent County with nearby schools including West Warwick High School.
Ownership History
Date
Name
Owned For
Owner Type
Purchase Details
Closed on
Feb 26, 2019
Sold by
Ackfoyd Beth and Ackroyd Carl
Bought by
Sabourin Jason and Sabourin Rachel
Current Estimated Value
Home Financials for this Owner
Home Financials are based on the most recent Mortgage that was taken out on this home.
Original Mortgage
$206,196
Outstanding Balance
$182,544
Interest Rate
4.75%
Mortgage Type
FHA
Estimated Equity
$204,336
Purchase Details
Closed on
Sep 2, 2005
Sold by
Zollo Pamela J
Bought by
Cunningham Phillip A and Cunningham Brenda L
Home Financials for this Owner
Home Financials are based on the most recent Mortgage that was taken out on this home.
Original Mortgage
$191,920
Interest Rate
5.81%
Mortgage Type
Purchase Money Mortgage
Purchase Details
Closed on
Nov 22, 2002
Sold by
Travassos Manuel F and Travassos Jeanne M
Bought by
Zollo Pamela J
Create a Home Valuation Report for This Property
The Home Valuation Report is an in-depth analysis detailing your home's value as well as a comparison with similar homes in the area
Home Values in the Area
Average Home Value in this Area
Purchase History
| Date | Buyer | Sale Price | Title Company |
|---|---|---|---|
| Sabourin Jason | $210,000 | -- | |
| Cunningham Phillip A | $240,000 | -- | |
| Zollo Pamela J | $145,500 | -- |
Source: Public Records
Mortgage History
| Date | Status | Borrower | Loan Amount |
|---|---|---|---|
| Open | Sabourin Jason | $206,196 | |
| Previous Owner | Zollo Pamela J | $191,920 | |
| Previous Owner | Zollo Pamela J | $47,980 | |
| Previous Owner | Zollo Pamela J | $192,500 | |
| Previous Owner | Zollo Pamela J | $25,000 |
Source: Public Records
Tax History Compared to Growth
Tax History
| Year | Tax Paid | Tax Assessment Tax Assessment Total Assessment is a certain percentage of the fair market value that is determined by local assessors to be the total taxable value of land and additions on the property. | Land | Improvement |
|---|---|---|---|---|
| 2025 | $5,049 | $353,300 | $109,300 | $244,000 |
| 2024 | $4,951 | $264,900 | $73,200 | $191,700 |
| 2023 | $4,853 | $264,900 | $73,200 | $191,700 |
| 2022 | $4,779 | $264,900 | $73,200 | $191,700 |
| 2021 | $4,409 | $191,700 | $61,000 | $130,700 |
| 2020 | $4,409 | $191,700 | $61,000 | $130,700 |
| 2019 | $5,621 | $191,700 | $61,000 | $130,700 |
| 2018 | $4,101 | $155,300 | $63,400 | $91,900 |
| 2017 | $4,086 | $155,300 | $63,400 | $91,900 |
| 2016 | $4,013 | $155,300 | $63,400 | $91,900 |
| 2015 | $3,972 | $153,000 | $63,400 | $89,600 |
| 2014 | $3,885 | $153,000 | $63,400 | $89,600 |
Source: Public Records
Map
Nearby Homes