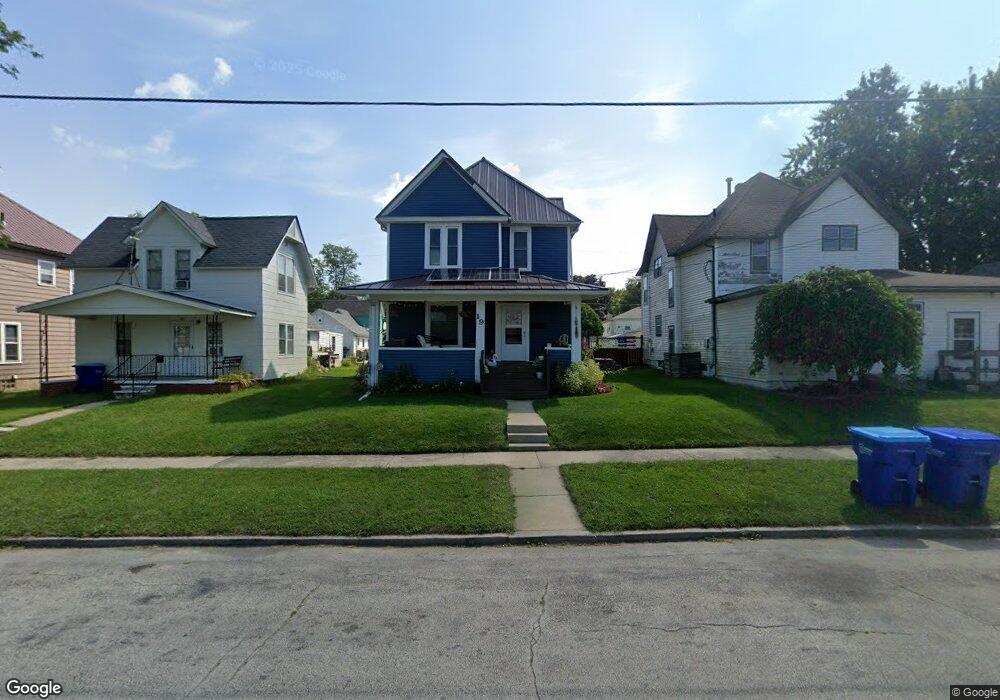
19 3rd Ave NE Oelwein, IA 50662
Estimated Value: $98,066 - $120,000
3
Beds
2
Baths
1,818
Sq Ft
$58/Sq Ft
Est. Value
About This Home
This home is located at 19 3rd Ave NE, Oelwein, IA 50662 and is currently estimated at $105,017, approximately $57 per square foot. 19 3rd Ave NE is a home located in Fayette County with nearby schools including Little Husky Learning Center, Wings Park Elementary School, and Parkside Elementary School.
Ownership History
Date
Name
Owned For
Owner Type
Purchase Details
Closed on
Feb 18, 2009
Sold by
Federal National Mortgage Association
Bought by
Growden John F
Current Estimated Value
Home Financials for this Owner
Home Financials are based on the most recent Mortgage that was taken out on this home.
Original Mortgage
$30,000
Outstanding Balance
$18,923
Interest Rate
5.06%
Mortgage Type
Purchase Money Mortgage
Estimated Equity
$86,094
Purchase Details
Closed on
Mar 23, 2007
Sold by
Rehlander Milton F and Rehlander Darliene R
Bought by
Deverell Brandon
Home Financials for this Owner
Home Financials are based on the most recent Mortgage that was taken out on this home.
Original Mortgage
$56,000
Interest Rate
6.27%
Mortgage Type
New Conventional
Create a Home Valuation Report for This Property
The Home Valuation Report is an in-depth analysis detailing your home's value as well as a comparison with similar homes in the area
Home Values in the Area
Average Home Value in this Area
Purchase History
| Date | Buyer | Sale Price | Title Company |
|---|---|---|---|
| Growden John F | -- | None Available | |
| Deverell Brandon | $56,000 | None Available |
Source: Public Records
Mortgage History
| Date | Status | Borrower | Loan Amount |
|---|---|---|---|
| Open | Growden John F | $30,000 | |
| Previous Owner | Deverell Brandon | $56,000 |
Source: Public Records
Tax History Compared to Growth
Tax History
| Year | Tax Paid | Tax Assessment Tax Assessment Total Assessment is a certain percentage of the fair market value that is determined by local assessors to be the total taxable value of land and additions on the property. | Land | Improvement |
|---|---|---|---|---|
| 2024 | $1,368 | $80,930 | $6,550 | $74,380 |
| 2023 | $1,336 | $80,930 | $6,550 | $74,380 |
| 2022 | $1,168 | $63,920 | $5,460 | $58,460 |
| 2021 | $1,168 | $63,920 | $5,460 | $58,460 |
| 2020 | $1,032 | $55,380 | $3,060 | $52,320 |
| 2019 | $1,104 | $58,490 | $0 | $0 |
| 2018 | $1,074 | $58,490 | $0 | $0 |
| 2017 | $682 | $38,720 | $0 | $0 |
| 2016 | $628 | $37,200 | $0 | $0 |
| 2015 | $628 | $0 | $0 | $0 |
| 2014 | $614 | $0 | $0 | $0 |
Source: Public Records
Map
Nearby Homes
- 219 2nd Ave NE
- 215 1st Ave NE
- 40 5th Ave SE
- 107 5th Ave SE
- 1312 3rd St NE
- 1204 3rd St NE
- 100 7th Ave SE
- 111 1st St NW
- 45 7th Ave SE
- 410 N Frederick Ave
- 23 4th St NW
- 420 Lincoln Dr
- 300 6th Ave SE
- 112 6th St NE
- 418 1st Ave NW
- 0 Parcel: 1822126038 Unit NBR20254735
- 0 Parcel: 1822126035 Unit NBR20254717
- 0 Unit NBR20253628
- 715 1st Ave NE
- Lots 111 & 112 SW 2nd Ave