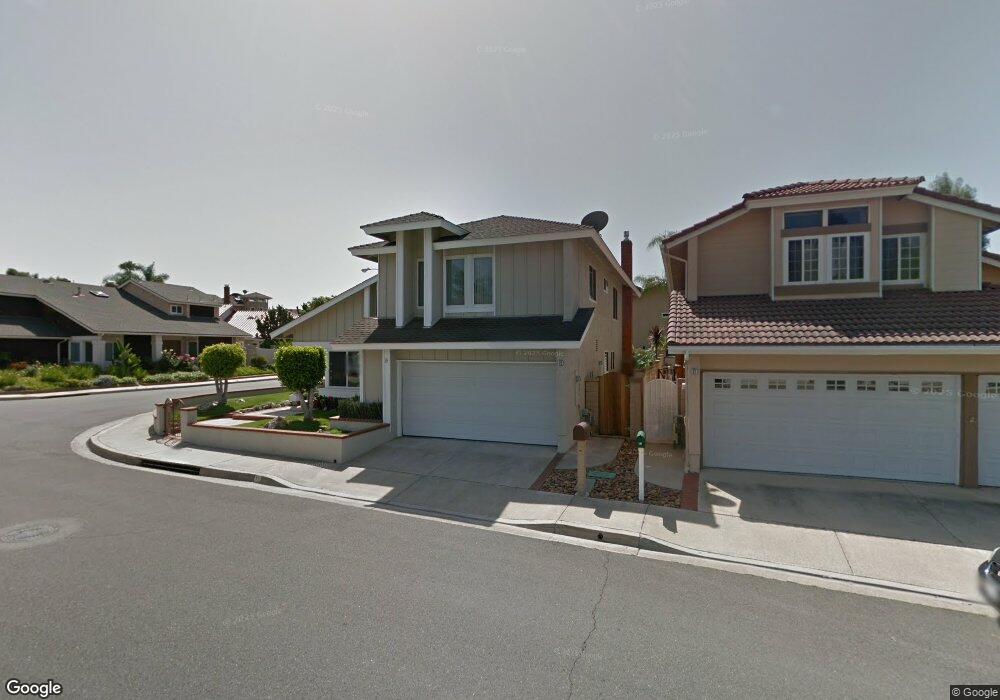
19 Allegheny Irvine, CA 92620
Northwood NeighborhoodEstimated Value: $1,721,487 - $2,149,000
4
Beds
3
Baths
2,495
Sq Ft
$777/Sq Ft
Est. Value
About This Home
This home is located at 19 Allegheny, Irvine, CA 92620 and is currently estimated at $1,937,872, approximately $776 per square foot. 19 Allegheny is a home located in Orange County with nearby schools including Northwood Elementary School, Sierra Vista Middle School, and Northwood High School.
Ownership History
Date
Name
Owned For
Owner Type
Purchase Details
Closed on
Jun 10, 2025
Sold by
Collins Gary Lee and Collins Vicky Lilliann
Bought by
Collins Family Trust and Collins
Current Estimated Value
Purchase Details
Closed on
Aug 10, 2015
Sold by
Collins Gary Lee and Collins Vicky Lilliann
Bought by
Collins Gary Lee and Collins Vicky Lilliann
Purchase Details
Closed on
Nov 22, 2002
Sold by
Collins Gary Lee and Collins Vicky Lilliann
Bought by
Collins Gary Lee and Collins Vicky Lilliann
Create a Home Valuation Report for This Property
The Home Valuation Report is an in-depth analysis detailing your home's value as well as a comparison with similar homes in the area
Home Values in the Area
Average Home Value in this Area
Purchase History
| Date | Buyer | Sale Price | Title Company |
|---|---|---|---|
| Collins Family Trust | -- | None Listed On Document | |
| Collins Gary Lee | -- | None Available | |
| Collins Gary Lee | -- | -- |
Source: Public Records
Tax History
| Year | Tax Paid | Tax Assessment Tax Assessment Total Assessment is a certain percentage of the fair market value that is determined by local assessors to be the total taxable value of land and additions on the property. | Land | Improvement |
|---|---|---|---|---|
| 2025 | $3,539 | $333,952 | $120,226 | $213,726 |
| 2024 | $3,539 | $327,404 | $117,868 | $209,536 |
| 2023 | $3,446 | $320,985 | $115,557 | $205,428 |
| 2022 | $3,374 | $314,692 | $113,292 | $201,400 |
| 2021 | $3,293 | $308,522 | $111,071 | $197,451 |
| 2020 | $3,274 | $305,359 | $109,932 | $195,427 |
| 2019 | $3,200 | $299,372 | $107,776 | $191,596 |
| 2018 | $3,140 | $293,502 | $105,662 | $187,840 |
| 2017 | $3,074 | $287,748 | $103,591 | $184,157 |
| 2016 | $2,941 | $282,106 | $101,559 | $180,547 |
| 2015 | $2,896 | $277,869 | $100,033 | $177,836 |
| 2014 | -- | $272,426 | $98,073 | $174,353 |
Source: Public Records
Map
Nearby Homes
Your Personal Tour Guide
Ask me questions while you tour the home.