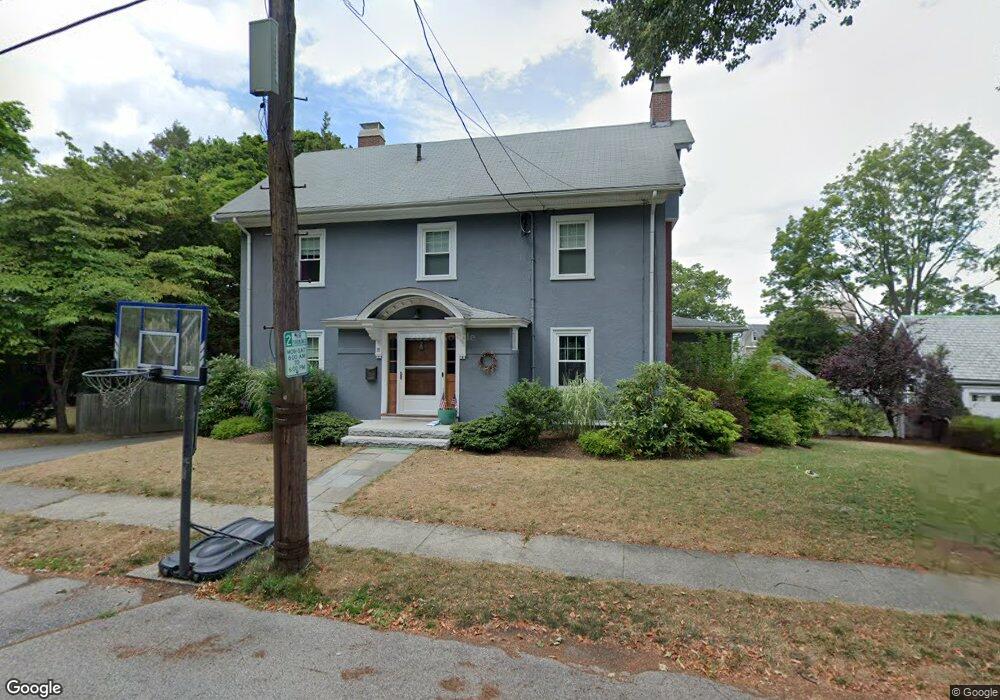
19 Andrews Rd Milton, MA 02186
Milton Hill NeighborhoodEstimated Value: $1,077,000 - $1,258,000
3
Beds
2
Baths
2,360
Sq Ft
$500/Sq Ft
Est. Value
About This Home
This home is located at 19 Andrews Rd, Milton, MA 02186 and is currently estimated at $1,178,973, approximately $499 per square foot. 19 Andrews Rd is a home located in Norfolk County with nearby schools including Milton High School, Codman Academy Charter Public School, and Conservatory Lab Upper School.
Ownership History
Date
Name
Owned For
Owner Type
Purchase Details
Closed on
Sep 25, 2020
Sold by
Powers Brian and Powers Mikalah
Bought by
Powers Rt and Powers
Current Estimated Value
Purchase Details
Closed on
May 13, 2020
Sold by
Powers Rt
Bought by
Powers Brian and Powers Mikalah
Home Financials for this Owner
Home Financials are based on the most recent Mortgage that was taken out on this home.
Original Mortgage
$276,000
Interest Rate
3.3%
Mortgage Type
New Conventional
Purchase Details
Closed on
Jan 31, 2013
Sold by
Powers Brian J and Powers Mikalah E
Bought by
Powers Rt and Powers
Purchase Details
Closed on
Apr 13, 2007
Sold by
Sweeney Geraldine P
Bought by
Powers Brian J and Powers Mikalah E
Home Financials for this Owner
Home Financials are based on the most recent Mortgage that was taken out on this home.
Original Mortgage
$417,000
Interest Rate
6.24%
Mortgage Type
Purchase Money Mortgage
Create a Home Valuation Report for This Property
The Home Valuation Report is an in-depth analysis detailing your home's value as well as a comparison with similar homes in the area
Home Values in the Area
Average Home Value in this Area
Purchase History
| Date | Buyer | Sale Price | Title Company |
|---|---|---|---|
| Powers Rt | -- | None Available | |
| Powers Brian | -- | None Available | |
| Powers Rt | -- | -- | |
| Powers Rt | -- | -- | |
| Powers Brian J | $525,000 | -- | |
| Powers Brian J | $525,000 | -- |
Source: Public Records
Mortgage History
| Date | Status | Borrower | Loan Amount |
|---|---|---|---|
| Previous Owner | Powers Brian | $276,000 | |
| Previous Owner | Powers Brian J | $403,000 | |
| Previous Owner | Powers Brian J | $24,100 | |
| Previous Owner | Powers Brian J | $417,000 |
Source: Public Records
Tax History Compared to Growth
Tax History
| Year | Tax Paid | Tax Assessment Tax Assessment Total Assessment is a certain percentage of the fair market value that is determined by local assessors to be the total taxable value of land and additions on the property. | Land | Improvement |
|---|---|---|---|---|
| 2025 | $10,860 | $979,300 | $517,100 | $462,200 |
| 2024 | $10,560 | $967,000 | $492,400 | $474,600 |
| 2023 | $10,385 | $911,000 | $469,000 | $442,000 |
| 2022 | $10,136 | $812,800 | $469,000 | $343,800 |
| 2021 | $9,762 | $743,500 | $416,000 | $327,500 |
| 2020 | $9,317 | $710,100 | $408,100 | $302,000 |
| 2019 | $9,088 | $689,500 | $396,300 | $293,200 |
| 2018 | $8,967 | $649,300 | $359,800 | $289,500 |
| 2017 | $8,394 | $619,000 | $342,600 | $276,400 |
| 2016 | $7,703 | $570,600 | $299,800 | $270,800 |
| 2015 | $7,576 | $543,500 | $278,400 | $265,100 |
Source: Public Records
Map
Nearby Homes
- 397 Adams St
- 400 Adams St Unit A
- 400 Adams St Unit B
- 639 Pleasant St Unit 639
- 639 Pleasant St
- 55 Christopher Dr
- 71 Cabot St
- 46 Century Ln
- 60 Pond St
- 51 Denmark Ave
- 41 Wallace Rd
- 66 Unity St
- 11 Rockwell Ave
- 64 Shawmut St
- 171 Milton St
- 461 Centre St
- 418 Pleasant St
- 111 Shawmut St
- 129-131 Pine St
- 73 Connell St
- 1263-1265 Brook Rd Unit 1
- 1263 Brook Rd Unit 1265
- 1263 Brook Rd Unit 1
- 23 Andrews Rd
- 15 Andrews Rd
- 1259 Brook Rd
- 1275 Brook Rd
- 16 Andrews Rd
- 8 Andrews Rd
- 24 Andrews Rd
- 28 Governors Rd
- 24 Governors Rd
- 1253 Brook Rd
- 30 Governors Rd
- 2 Andrews Rd
- 34 Governors Rd
- 1272 Brook Rd
- 1264 Brook Rd
- 33 Hollis St
- 12 Babcock St