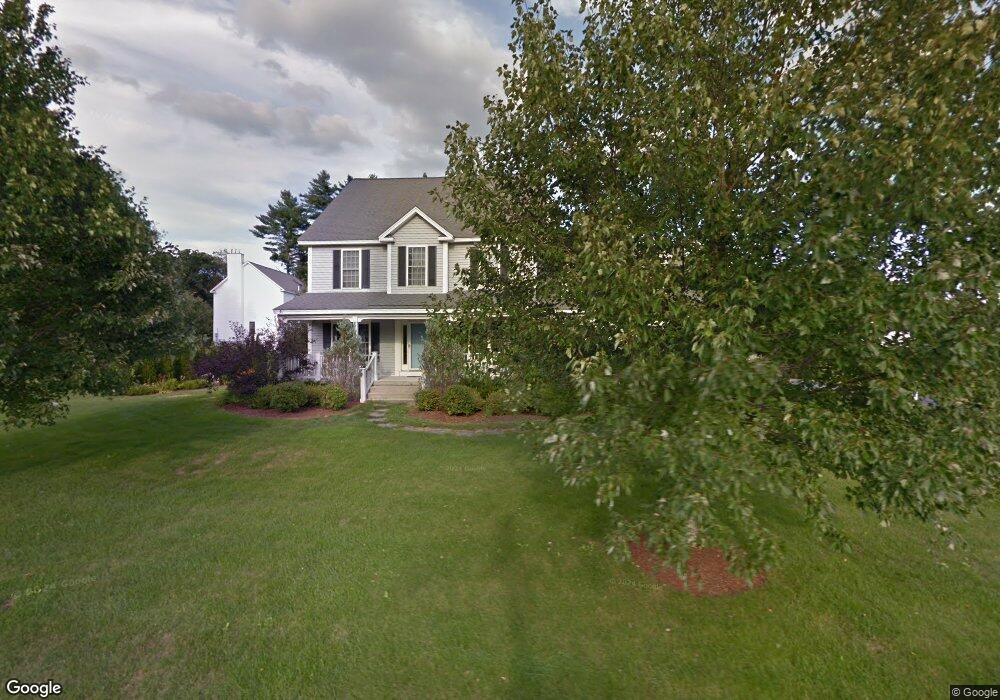
19 Barnside Dr Bedford, NH 03110
Bedford NeighborhoodEstimated Value: $901,157 - $963,000
4
Beds
3
Baths
2,876
Sq Ft
$326/Sq Ft
Est. Value
About This Home
This home is located at 19 Barnside Dr, Bedford, NH 03110 and is currently estimated at $938,039, approximately $326 per square foot. 19 Barnside Dr is a home located in Hillsborough County with nearby schools including Mckelvie Intermediate School, Ross A. Lurgio Middle School, and Bedford High School.
Ownership History
Date
Name
Owned For
Owner Type
Purchase Details
Closed on
Aug 9, 2017
Sold by
Mcmanus Donald D and Mcmanus Karla S
Bought by
Mcmanus Ret
Current Estimated Value
Purchase Details
Closed on
Dec 2, 1999
Sold by
Dac Invst Corp
Bought by
Mcmanus Donald D and Mcmanus Karla S
Home Financials for this Owner
Home Financials are based on the most recent Mortgage that was taken out on this home.
Original Mortgage
$215,900
Interest Rate
7.86%
Create a Home Valuation Report for This Property
The Home Valuation Report is an in-depth analysis detailing your home's value as well as a comparison with similar homes in the area
Home Values in the Area
Average Home Value in this Area
Purchase History
| Date | Buyer | Sale Price | Title Company |
|---|---|---|---|
| Mcmanus Ret | -- | -- | |
| Mcmanus Donald D | $269,900 | -- |
Source: Public Records
Mortgage History
| Date | Status | Borrower | Loan Amount |
|---|---|---|---|
| Previous Owner | Mcmanus Donald D | $40,000 | |
| Previous Owner | Mcmanus Donald D | $219,000 | |
| Previous Owner | Mcmanus Donald D | $215,900 |
Source: Public Records
Tax History Compared to Growth
Tax History
| Year | Tax Paid | Tax Assessment Tax Assessment Total Assessment is a certain percentage of the fair market value that is determined by local assessors to be the total taxable value of land and additions on the property. | Land | Improvement |
|---|---|---|---|---|
| 2024 | $12,356 | $781,500 | $334,100 | $447,400 |
| 2023 | $11,566 | $781,500 | $334,100 | $447,400 |
| 2022 | $10,620 | $603,400 | $247,300 | $356,100 |
| 2021 | $10,342 | $603,400 | $247,300 | $356,100 |
| 2020 | $10,298 | $514,400 | $196,800 | $317,600 |
| 2019 | $9,748 | $514,400 | $196,800 | $317,600 |
| 2018 | $9,806 | $480,700 | $196,800 | $283,900 |
| 2017 | $9,090 | $480,700 | $196,800 | $283,900 |
| 2016 | $8,387 | $374,900 | $110,100 | $264,800 |
| 2015 | $8,533 | $374,900 | $110,100 | $264,800 |
| 2014 | $8,435 | $374,900 | $110,100 | $264,800 |
| 2013 | $8,312 | $374,900 | $110,100 | $264,800 |
Source: Public Records
Map
Nearby Homes