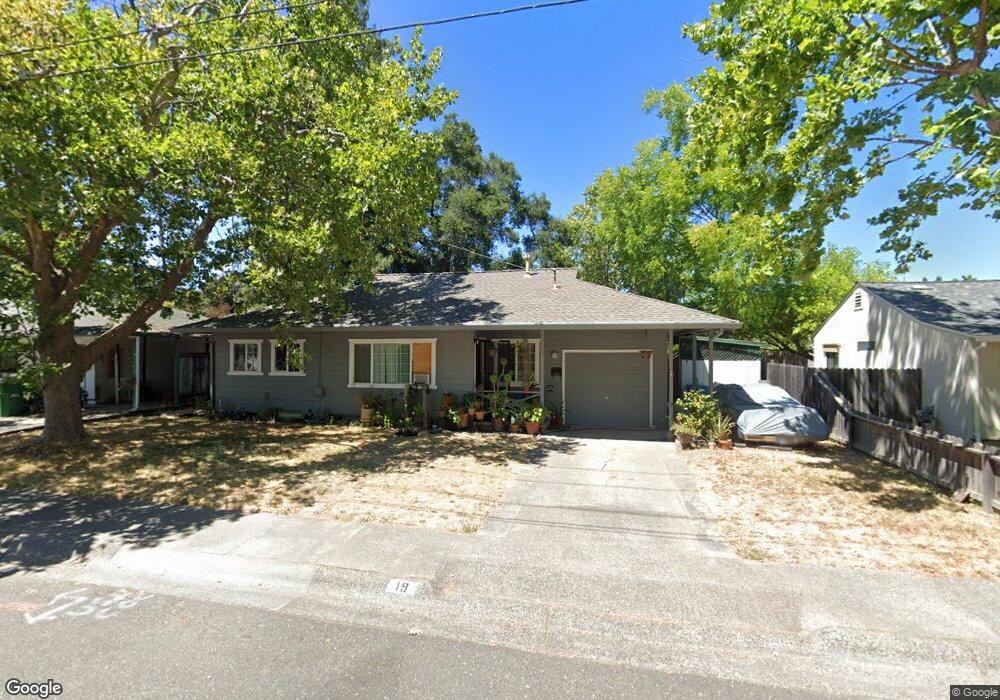
19 Blair St Cloverdale, CA 95425
Estimated Value: $498,000 - $608,000
3
Beds
1
Bath
927
Sq Ft
$584/Sq Ft
Est. Value
About This Home
This home is located at 19 Blair St, Cloverdale, CA 95425 and is currently estimated at $541,149, approximately $583 per square foot. 19 Blair St is a home located in Sonoma County with nearby schools including Washington School, Jefferson Elementary School, and Cloverdale High School.
Ownership History
Date
Name
Owned For
Owner Type
Purchase Details
Closed on
Dec 15, 2021
Sold by
Calvo Genaro Soriano
Bought by
Calvo Genaro Soriano and Ruiz Meza Magdalena
Current Estimated Value
Home Financials for this Owner
Home Financials are based on the most recent Mortgage that was taken out on this home.
Original Mortgage
$320,000
Outstanding Balance
$293,800
Interest Rate
2.98%
Mortgage Type
New Conventional
Estimated Equity
$247,349
Purchase Details
Closed on
May 18, 2010
Sold by
Ruiz Calvo Genaro Soriano and Ruiz Meza Magdalena
Bought by
Calvo Genaro Soriano
Purchase Details
Closed on
Oct 29, 2002
Sold by
Giovannetti Kenneth Charles and Leland Gail Cynthia
Bought by
Ruiz Calvo Genaro Soriano and Ruiz Meza Magdalena
Home Financials for this Owner
Home Financials are based on the most recent Mortgage that was taken out on this home.
Original Mortgage
$255,550
Interest Rate
5.37%
Create a Home Valuation Report for This Property
The Home Valuation Report is an in-depth analysis detailing your home's value as well as a comparison with similar homes in the area
Home Values in the Area
Average Home Value in this Area
Purchase History
| Date | Buyer | Sale Price | Title Company |
|---|---|---|---|
| Calvo Genaro Soriano | $160,000 | Fidelity National Title Co | |
| Calvo Genaro Soriano | -- | None Available | |
| Ruiz Calvo Genaro Soriano | $263,500 | Chicago Title Co |
Source: Public Records
Mortgage History
| Date | Status | Borrower | Loan Amount |
|---|---|---|---|
| Open | Calvo Genaro Soriano | $320,000 | |
| Previous Owner | Ruiz Calvo Genaro Soriano | $255,550 |
Source: Public Records
Tax History Compared to Growth
Tax History
| Year | Tax Paid | Tax Assessment Tax Assessment Total Assessment is a certain percentage of the fair market value that is determined by local assessors to be the total taxable value of land and additions on the property. | Land | Improvement |
|---|---|---|---|---|
| 2025 | $3,706 | $287,613 | $93,816 | $193,797 |
| 2024 | $3,706 | $281,975 | $91,977 | $189,998 |
| 2023 | $3,706 | $276,447 | $90,174 | $186,273 |
| 2022 | $3,638 | $271,027 | $88,406 | $182,621 |
| 2021 | $3,594 | $265,714 | $86,673 | $179,041 |
| 2020 | $3,583 | $262,991 | $85,785 | $177,206 |
| 2019 | $3,518 | $257,835 | $84,103 | $173,732 |
| 2018 | $3,319 | $252,780 | $82,454 | $170,326 |
| 2017 | $3,267 | $247,825 | $80,838 | $166,987 |
| 2016 | $3,205 | $242,966 | $79,253 | $163,713 |
| 2015 | $3,060 | $239,317 | $78,063 | $161,254 |
| 2014 | $2,403 | $185,000 | $60,000 | $125,000 |
Source: Public Records
Map
Nearby Homes
- 12 Alana Way
- 31280 California 128
- 34996 California 128
- 28 Tarman Dr Unit A-B
- 130 Elm St
- 540 S Cloverdale Blvd
- 165 Stonegate Cir Unit E
- 180 Healdsburg Ave Unit A
- 175 Stonegate Cir Unit C
- 110 Syrah Ct
- 28365 Redwood Hwy
- 462 Riesling St
- 418 W Cherry Creek Rd
- 483 S Foothill Blvd
- 107 St Michael Ct
- 1201 S Cloverdale Blvd
- 303 W 2nd St
- 112 Zinfandel Ct
- 593 W 2nd St
- 300 W Cherry Creek Rd