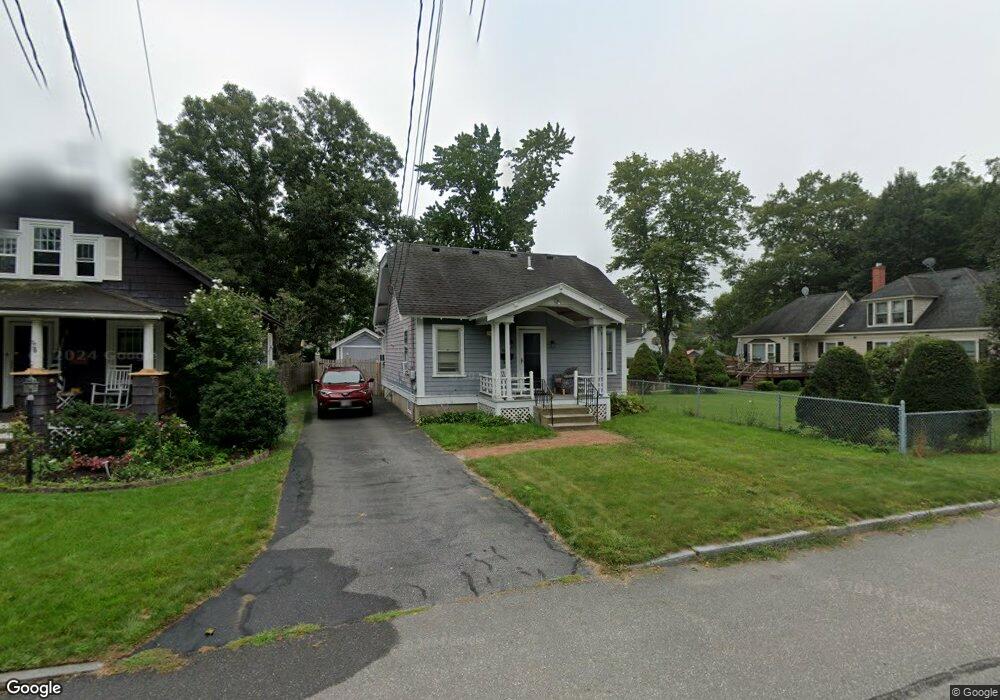
19 Broad Ave Concord, NH 03301
South End NeighborhoodEstimated Value: $400,400 - $451,000
2
Beds
2
Baths
1,254
Sq Ft
$340/Sq Ft
Est. Value
About This Home
This home is located at 19 Broad Ave, Concord, NH 03301 and is currently estimated at $425,850, approximately $339 per square foot. 19 Broad Ave is a home located in Merrimack County with nearby schools including Abbot-Downing School, Rundlett Middle School, and Concord High School.
Ownership History
Date
Name
Owned For
Owner Type
Purchase Details
Closed on
Jul 1, 1996
Sold by
Hickey William D and Hickey Martha
Bought by
Maloney Judith A
Current Estimated Value
Home Financials for this Owner
Home Financials are based on the most recent Mortgage that was taken out on this home.
Original Mortgage
$81,135
Interest Rate
8.05%
Mortgage Type
Purchase Money Mortgage
Create a Home Valuation Report for This Property
The Home Valuation Report is an in-depth analysis detailing your home's value as well as a comparison with similar homes in the area
Home Values in the Area
Average Home Value in this Area
Purchase History
| Date | Buyer | Sale Price | Title Company |
|---|---|---|---|
| Maloney Judith A | $81,500 | -- |
Source: Public Records
Mortgage History
| Date | Status | Borrower | Loan Amount |
|---|---|---|---|
| Open | Maloney Judith A | $77,500 | |
| Closed | Maloney Judith A | $81,135 |
Source: Public Records
Tax History
| Year | Tax Paid | Tax Assessment Tax Assessment Total Assessment is a certain percentage of the fair market value that is determined by local assessors to be the total taxable value of land and additions on the property. | Land | Improvement |
|---|---|---|---|---|
| 2025 | $6,940 | $238,400 | $114,800 | $123,600 |
| 2024 | $6,601 | $238,400 | $114,800 | $123,600 |
| 2023 | $6,403 | $238,400 | $114,800 | $123,600 |
| 2022 | $6,172 | $238,400 | $114,800 | $123,600 |
| 2021 | $5,956 | $237,100 | $114,800 | $122,300 |
| 2020 | $5,796 | $216,600 | $100,700 | $115,900 |
| 2019 | $5,445 | $196,000 | $100,700 | $95,300 |
| 2018 | $5,452 | $193,400 | $104,000 | $89,400 |
| 2017 | $5,315 | $188,200 | $102,100 | $86,100 |
| 2016 | $5,022 | $181,500 | $102,100 | $79,400 |
| 2015 | $4,872 | $174,400 | $95,800 | $78,600 |
| 2014 | $4,676 | $174,400 | $95,800 | $78,600 |
| 2013 | -- | $172,200 | $95,800 | $76,400 |
| 2012 | -- | $182,300 | $104,900 | $77,400 |
Source: Public Records
Map
Nearby Homes
- 335 S Main St
- 33 Joffre St
- 0 South St Unit 4969509
- 40 Nivelle St
- 289 South St
- 273-279 S Main St
- 47 Noyes St
- 30 Longmeadow Dr
- 47 South St
- 111 -113 South Main St
- 58 S State St
- 7-9 Myrtle St
- 25 N Spring St
- 21 Fairfield Dr
- 22 Fairfield Dr
- 20 Fairfield Dr
- 5 Holly Cir
- 5 Windchime Dr
- 4 Bow Center Rd Unit F2
- 26 Jonathan Ln
Your Personal Tour Guide
Ask me questions while you tour the home.