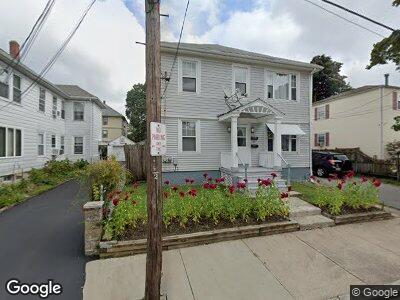
19 Burke St Pawtucket, RI 02861
Darlington NeighborhoodEstimated Value: $455,523 - $559,000
6
Beds
2
Baths
2,460
Sq Ft
$209/Sq Ft
Est. Value
About This Home
This home is located at 19 Burke St, Pawtucket, RI 02861 and is currently estimated at $514,131, approximately $208 per square foot. 19 Burke St is a home located in Providence County with nearby schools including St Cecilia School and Saint Raphael Academy.
Ownership History
Date
Name
Owned For
Owner Type
Purchase Details
Closed on
Aug 15, 2002
Sold by
Card Glen M and Card Linda A
Bought by
Castrillon Alberto
Current Estimated Value
Home Financials for this Owner
Home Financials are based on the most recent Mortgage that was taken out on this home.
Original Mortgage
$180,400
Interest Rate
6.61%
Purchase Details
Closed on
Apr 1, 1991
Sold by
Fisher Scott W
Bought by
Card Glenn M
Home Financials for this Owner
Home Financials are based on the most recent Mortgage that was taken out on this home.
Original Mortgage
$125,000
Interest Rate
9.17%
Purchase Details
Closed on
Nov 2, 1988
Sold by
Lariviere Ronald
Bought by
Fisher Sandra
Home Financials for this Owner
Home Financials are based on the most recent Mortgage that was taken out on this home.
Original Mortgage
$104,500
Interest Rate
10.33%
Create a Home Valuation Report for This Property
The Home Valuation Report is an in-depth analysis detailing your home's value as well as a comparison with similar homes in the area
Home Values in the Area
Average Home Value in this Area
Purchase History
| Date | Buyer | Sale Price | Title Company |
|---|---|---|---|
| Castrillon Alberto | $190,000 | -- | |
| Card Glenn M | $125,000 | -- | |
| Fisher Sandra | $110,000 | -- |
Source: Public Records
Mortgage History
| Date | Status | Borrower | Loan Amount |
|---|---|---|---|
| Open | Hough Timothy | $193,000 | |
| Closed | Fisher Sandra | $180,400 | |
| Previous Owner | Fisher Sandra | $127,500 | |
| Previous Owner | Fisher Sandra | $125,000 | |
| Previous Owner | Fisher Sandra | $104,500 |
Source: Public Records
Tax History Compared to Growth
Tax History
| Year | Tax Paid | Tax Assessment Tax Assessment Total Assessment is a certain percentage of the fair market value that is determined by local assessors to be the total taxable value of land and additions on the property. | Land | Improvement |
|---|---|---|---|---|
| 2024 | $5,257 | $426,000 | $122,900 | $303,100 |
| 2023 | $4,923 | $290,600 | $76,800 | $213,800 |
| 2022 | $4,818 | $290,600 | $76,800 | $213,800 |
| 2021 | $4,818 | $290,600 | $76,800 | $213,800 |
| 2020 | $4,216 | $201,800 | $60,700 | $141,100 |
| 2019 | $4,216 | $201,800 | $60,700 | $141,100 |
| 2018 | $4,062 | $201,800 | $60,700 | $141,100 |
| 2017 | $3,640 | $160,200 | $49,700 | $110,500 |
| 2016 | $3,507 | $160,200 | $49,700 | $110,500 |
| 2015 | $3,507 | $160,200 | $49,700 | $110,500 |
| 2014 | $3,468 | $150,400 | $49,700 | $100,700 |
Source: Public Records
Map
Nearby Homes