Estimated Value: $629,000 - $683,000
4
Beds
3
Baths
2,064
Sq Ft
$317/Sq Ft
Est. Value
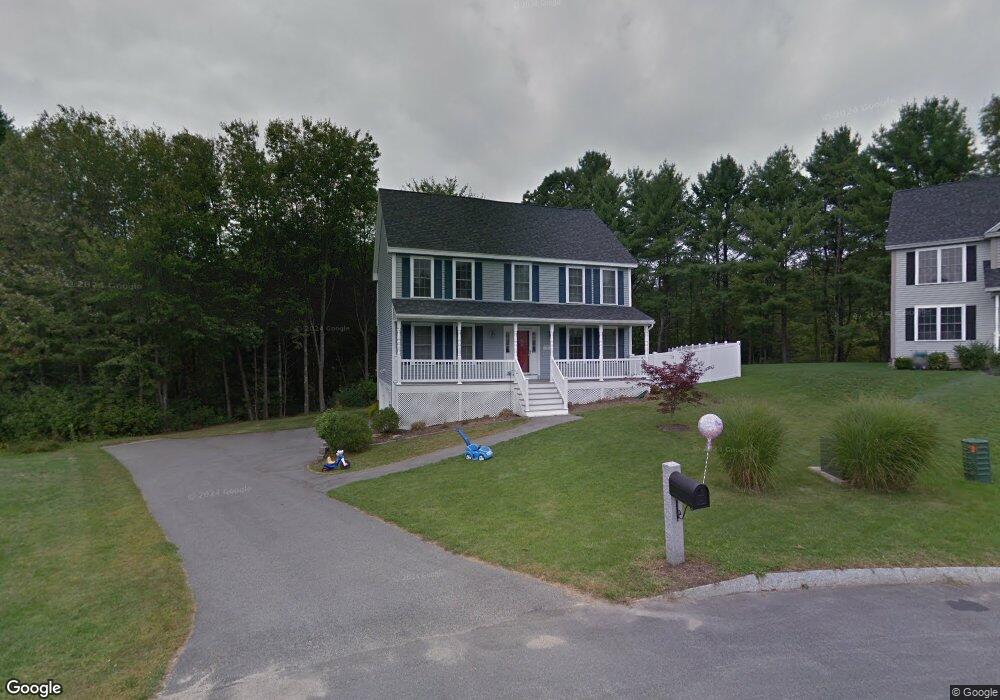
About This Home
This home is located at 19 Cassily Ln, Dover, NH 03820 and is currently estimated at $653,746, approximately $316 per square foot. 19 Cassily Ln is a home located in Strafford County with nearby schools including Horne Street School, Dover Middle School, and Dover Senior High School.
Ownership History
Date
Name
Owned For
Owner Type
Purchase Details
Closed on
Oct 3, 2019
Sold by
Cedrone Ft
Bought by
Cedrone Michelle P
Current Estimated Value
Home Financials for this Owner
Home Financials are based on the most recent Mortgage that was taken out on this home.
Original Mortgage
$248,000
Outstanding Balance
$216,813
Interest Rate
3.4%
Mortgage Type
New Conventional
Estimated Equity
$436,933
Purchase Details
Closed on
Apr 27, 2015
Sold by
Cedrone Matthew J and Cedrone Michelle P
Bought by
Cedrone Ft
Purchase Details
Closed on
Nov 3, 2006
Sold by
Aladdin Dev Corp
Bought by
Cedrone Matthew J and Cedrone Michelle P
Home Financials for this Owner
Home Financials are based on the most recent Mortgage that was taken out on this home.
Original Mortgage
$259,920
Interest Rate
6.47%
Create a Home Valuation Report for This Property
The Home Valuation Report is an in-depth analysis detailing your home's value as well as a comparison with similar homes in the area
Home Values in the Area
Average Home Value in this Area
Purchase History
| Date | Buyer | Sale Price | Title Company |
|---|---|---|---|
| Cedrone Michelle P | -- | -- | |
| Cedrone Ft | -- | -- | |
| Cedrone Matthew J | $324,900 | -- | |
| Cedrone Michelle P | $324,900 | -- |
Source: Public Records
Mortgage History
| Date | Status | Borrower | Loan Amount |
|---|---|---|---|
| Open | Cedrone Michelle P | $248,000 | |
| Previous Owner | Cedrone Michelle P | $259,920 |
Source: Public Records
Tax History Compared to Growth
Tax History
| Year | Tax Paid | Tax Assessment Tax Assessment Total Assessment is a certain percentage of the fair market value that is determined by local assessors to be the total taxable value of land and additions on the property. | Land | Improvement |
|---|---|---|---|---|
| 2024 | $10,698 | $588,800 | $175,900 | $412,900 |
| 2023 | $9,976 | $533,500 | $167,100 | $366,400 |
| 2022 | $9,866 | $497,300 | $167,100 | $330,200 |
| 2021 | $9,346 | $430,700 | $140,700 | $290,000 |
| 2020 | $8,814 | $354,700 | $114,400 | $240,300 |
| 2019 | $8,811 | $349,800 | $114,400 | $235,400 |
| 2018 | $8,455 | $339,300 | $105,600 | $233,700 |
| 2017 | $8,372 | $323,600 | $96,800 | $226,800 |
| 2016 | $8,063 | $306,700 | $91,400 | $215,300 |
| 2015 | $7,940 | $298,400 | $91,400 | $207,000 |
| 2014 | $7,761 | $298,400 | $91,400 | $207,000 |
| 2011 | $7,132 | $283,900 | $86,800 | $197,100 |
Source: Public Records
Map
Nearby Homes
- 20 Whittier St
- 24 Conifer Commons
- 80 Glenwood Ave
- 2 Arcola St
- 12 Stocklan Cir
- 60 Horne St
- 63 Sixth St
- 4A Smith Well Rd
- 28 Singh Dr
- 1 Prospect Ct
- 5 Prospect St
- 105-107 Mount Vernon St
- 725 Central Ave Unit 302
- 725 Central Ave Unit 304
- 725 Central Ave Unit LL03
- 725 Central Ave Unit 202
- 725 Central Ave Unit 203
- 725 Central Ave Unit LL02
- 725 Central Ave Unit LL01
- 725 Central Ave Unit 201