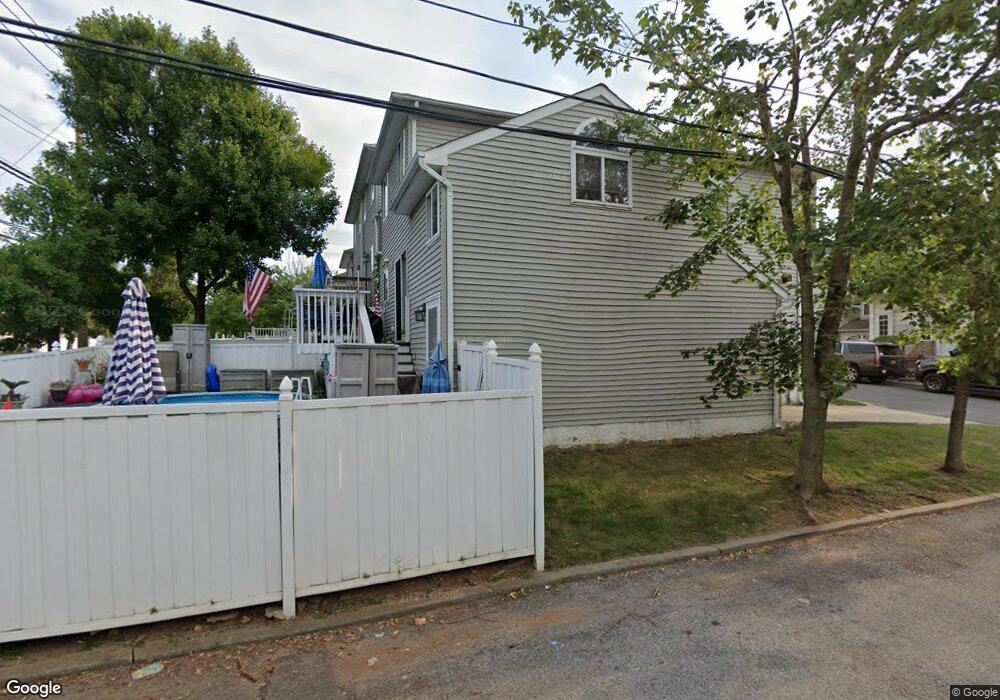
19 Crabtree Ln Staten Island, NY 10309
Rossville NeighborhoodEstimated Value: $1,325,000 - $1,829,748
--
Bed
--
Bath
4,124
Sq Ft
$370/Sq Ft
Est. Value
About This Home
This home is located at 19 Crabtree Ln, Staten Island, NY 10309 and is currently estimated at $1,523,916, approximately $369 per square foot. 19 Crabtree Ln is a home located in Richmond County with nearby schools including Kathleen Grimm School For Leadership, P.S. 56 - The Louis Desario School, and Is 34 Tottenville.
Ownership History
Date
Name
Owned For
Owner Type
Purchase Details
Closed on
Nov 3, 2022
Sold by
Universal Building Solutions Corp
Bought by
Mazzola Irrevocable Trust
Current Estimated Value
Purchase Details
Closed on
Oct 25, 2021
Sold by
Cee Jay Real Estate Development Corp
Bought by
Universal Building Solutions Corp
Home Financials for this Owner
Home Financials are based on the most recent Mortgage that was taken out on this home.
Original Mortgage
$200,000
Interest Rate
2.88%
Mortgage Type
Purchase Money Mortgage
Purchase Details
Closed on
Dec 18, 2014
Sold by
Block 7093 Corp
Bought by
Harris Lane Associates Corp
Purchase Details
Closed on
Nov 4, 1998
Sold by
Depaulis Phil F
Bought by
Block 7093 Corp
Create a Home Valuation Report for This Property
The Home Valuation Report is an in-depth analysis detailing your home's value as well as a comparison with similar homes in the area
Home Values in the Area
Average Home Value in this Area
Purchase History
| Date | Buyer | Sale Price | Title Company |
|---|---|---|---|
| Mazzola Irrevocable Trust | $1,247,356 | Chicago Title | |
| Universal Building Solutions Corp | $825,000 | Gem Abstract Corp | |
| Harris Lane Associates Corp | $146,000 | None Available | |
| Block 7093 Corp | -- | Old Republic Natl Title Ins | |
| Depaulus Phil F | $70,000 | -- |
Source: Public Records
Mortgage History
| Date | Status | Borrower | Loan Amount |
|---|---|---|---|
| Previous Owner | Universal Building Solutions Corp | $200,000 |
Source: Public Records
Tax History Compared to Growth
Tax History
| Year | Tax Paid | Tax Assessment Tax Assessment Total Assessment is a certain percentage of the fair market value that is determined by local assessors to be the total taxable value of land and additions on the property. | Land | Improvement |
|---|---|---|---|---|
| 2025 | $12,039 | $91,920 | $17,294 | $74,626 |
| 2024 | $12,039 | $79,980 | $18,751 | $61,229 |
| 2023 | $11,484 | $56,548 | $6,388 | $50,160 |
| 2022 | $1,203 | $19,020 | $19,020 | $0 |
| 2021 | $1,196 | $19,020 | $19,020 | $0 |
| 2020 | $1,678 | $20,040 | $20,040 | $0 |
| 2019 | $1,058 | $20,040 | $20,040 | $0 |
| 2018 | $973 | $4,773 | $4,773 | $0 |
| 2017 | $1,972 | $9,672 | $9,146 | $526 |
| 2016 | $1,868 | $9,343 | $8,466 | $877 |
| 2015 | $1,604 | $8,832 | $5,818 | $3,014 |
| 2014 | $1,604 | $8,359 | $4,683 | $3,676 |
Source: Public Records
Map
Nearby Homes
- 669 Bloomingdale Rd
- 31 Harris Ln
- 30 Harris Ln
- 16 Harris Ln
- 24 Harris Ln
- 1527 Woodrow Rd
- 19 Lynbrook Ct
- 298 Kramer Ave
- 97 Crabtree Ave
- 62 Dexter Ave
- 24 Brookside Loop
- 141 Shiel Ave
- 137 Shiel Ave
- 28 Brookside Loop
- 119 Berkshire Ln
- 816 Bloomingdale Rd
- 222 McBaine Ave
- 126 Lorraine Loop
- 218 McBaine Ave
- 11 Jessica Ln
- 19 Crabtree Ln
- 17 Crabtree Ln
- 21 Crabtree Ln
- 15 Crabtree Ln
- 31 Crabtree Ln
- 20 Crabtree Ln
- 16 Crabtree Ln
- 22 Crabtree Ln
- 14 Crabtree Ln
- 26 Crabtree Ln
- 28 Crabtree Ln
- 33 Crabtree Ln
- 682 Bloomingdale Rd
- 34 Crabtree Ln
- 684 Bloomingdale Rd
- 36 Crabtree Ln
- 688 Bloomingdale Rd
- 11 Crabtree Ave
- 690 Bloomingdale Rd
- 15 Crabtree Ave