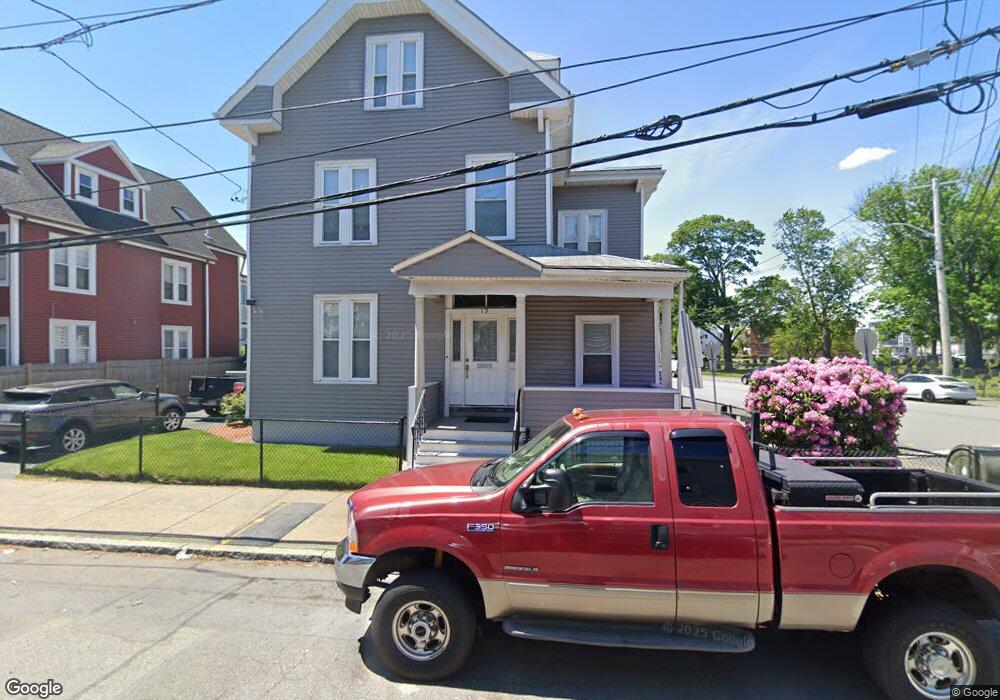
19 Elm St Lynn, MA 01905
West Lynn NeighborhoodEstimated Value: $788,000 - $929,000
6
Beds
3
Baths
3,152
Sq Ft
$281/Sq Ft
Est. Value
About This Home
This home is located at 19 Elm St, Lynn, MA 01905 and is currently estimated at $884,246, approximately $280 per square foot. 19 Elm St is a home located in Essex County with nearby schools including William P Connery Elementary School, William R. Fallon School, and Fecteau-Leary Junior/Senior High School.
Ownership History
Date
Name
Owned For
Owner Type
Purchase Details
Closed on
Jun 1, 2001
Sold by
Est Socci Kay M and Taylor Pauline
Bought by
Williams Gloria A and Chapman Frances
Current Estimated Value
Home Financials for this Owner
Home Financials are based on the most recent Mortgage that was taken out on this home.
Original Mortgage
$139,650
Interest Rate
7.09%
Mortgage Type
Purchase Money Mortgage
Create a Home Valuation Report for This Property
The Home Valuation Report is an in-depth analysis detailing your home's value as well as a comparison with similar homes in the area
Home Values in the Area
Average Home Value in this Area
Purchase History
| Date | Buyer | Sale Price | Title Company |
|---|---|---|---|
| Williams Gloria A | $147,000 | -- | |
| Williams Gloria A | $147,000 | -- |
Source: Public Records
Mortgage History
| Date | Status | Borrower | Loan Amount |
|---|---|---|---|
| Open | Williams Gloria A | $216,000 | |
| Closed | Williams Gloria A | $139,650 |
Source: Public Records
Tax History
| Year | Tax Paid | Tax Assessment Tax Assessment Total Assessment is a certain percentage of the fair market value that is determined by local assessors to be the total taxable value of land and additions on the property. | Land | Improvement |
|---|---|---|---|---|
| 2025 | $9,607 | $927,276 | $202,300 | $724,976 |
| 2024 | $9,034 | $857,900 | $185,800 | $672,100 |
| 2023 | $8,830 | $791,900 | $165,500 | $626,400 |
| 2022 | $9,181 | $738,600 | $155,600 | $583,000 |
| 2021 | $8,470 | $650,000 | $128,400 | $521,600 |
| 2020 | $7,686 | $573,600 | $107,200 | $466,400 |
| 2019 | $7,333 | $512,800 | $92,100 | $420,700 |
| 2018 | $6,948 | $458,600 | $100,700 | $357,900 |
| 2017 | $6,605 | $423,400 | $89,000 | $334,400 |
| 2016 | $5,839 | $360,900 | $84,300 | $276,600 |
| 2015 | $5,385 | $321,500 | $72,600 | $248,900 |
Source: Public Records
Map
Nearby Homes
- 117 South St
- 101 Commercial St
- 20 Murray St
- 78-80 Spencer St
- 66 Harwood St
- 95 Oakville St
- 45 Cottage St Unit 3
- 73 Waterhill St
- 43 Baker St
- 6 Morris St
- 24 Hathaway St
- 50 S Common St Unit 508
- 50 S Common St Unit 405
- 50-50A Kirtland St
- 274 Boston St
- 16 Salem St
- 136 Franklin St
- 99 Franklin St
- 81A Franklin St
- 28 Wyman St
Your Personal Tour Guide
Ask me questions while you tour the home.