Estimated Value: $477,000 - $564,295
3
Beds
2
Baths
1,646
Sq Ft
$320/Sq Ft
Est. Value
About This Home
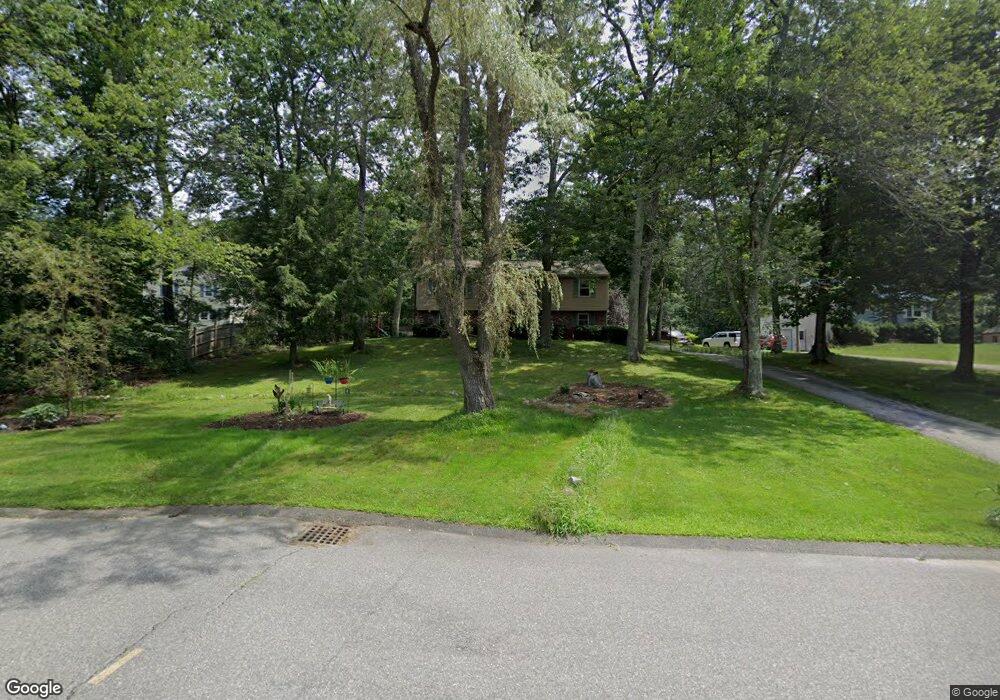
This home is located at 19 Emerald Dr, Derry, NH 03038 and is currently estimated at $526,324, approximately $319 per square foot. 19 Emerald Dr is a home located in Rockingham County with nearby schools including Ernest P. Barka Elementary School, Gilbert H. Hood Middle School, and Pinkerton Academy.
Ownership History
Date
Name
Owned For
Owner Type
Purchase Details
Closed on
May 6, 2016
Sold by
Leyland Lisa M
Bought by
Leyland 3Rd Edward J
Current Estimated Value
Purchase Details
Closed on
May 29, 1998
Sold by
Christenbery Barbara A
Bought by
Leyland Lisa M and Leyland Edward J
Home Financials for this Owner
Home Financials are based on the most recent Mortgage that was taken out on this home.
Original Mortgage
$129,602
Interest Rate
7.12%
Create a Home Valuation Report for This Property
The Home Valuation Report is an in-depth analysis detailing your home's value as well as a comparison with similar homes in the area
Home Values in the Area
Average Home Value in this Area
Purchase History
| Date | Buyer | Sale Price | Title Company |
|---|---|---|---|
| Leyland 3Rd Edward J | -- | -- | |
| Leyland Lisa M | $130,200 | -- |
Source: Public Records
Mortgage History
| Date | Status | Borrower | Loan Amount |
|---|---|---|---|
| Previous Owner | Leyland Lisa M | $196,000 | |
| Previous Owner | Leyland Lisa M | $129,602 |
Source: Public Records
Tax History
| Year | Tax Paid | Tax Assessment Tax Assessment Total Assessment is a certain percentage of the fair market value that is determined by local assessors to be the total taxable value of land and additions on the property. | Land | Improvement |
|---|---|---|---|---|
| 2024 | $8,678 | $464,300 | $209,900 | $254,400 |
| 2023 | $7,912 | $382,600 | $178,400 | $204,200 |
| 2022 | $7,285 | $382,600 | $178,400 | $204,200 |
| 2021 | $7,430 | $300,100 | $136,300 | $163,800 |
| 2020 | $7,304 | $300,100 | $136,300 | $163,800 |
| 2019 | $6,817 | $261,000 | $105,200 | $155,800 |
| 2018 | $6,911 | $265,500 | $105,200 | $160,300 |
| 2017 | $6,990 | $242,200 | $95,200 | $147,000 |
| 2016 | $6,554 | $242,200 | $95,200 | $147,000 |
| 2015 | $6,743 | $230,700 | $95,200 | $135,500 |
| 2014 | $6,787 | $230,700 | $95,200 | $135,500 |
| 2013 | $6,742 | $214,100 | $87,200 | $126,900 |
Source: Public Records
Map
Nearby Homes
- 20.5 Emerald Dr
- 52 Daniel Rd
- 54 Daniel Rd
- 14 Cove Dr
- 56 Daniel Rd
- 8 Mark Ave
- 6 Hilda Ave
- 109 Bypass 28
- 25 English Range Rd Unit B
- 47 Clover Ln
- 80 Bypass 28
- 80.5 English Range Rd
- 40 Pinyon Place
- 10 Auburn Rd
- 9 Barkland Dr
- 7 Birchwood Dr
- 6 Barkland Dr
- 103 Rockingham Rd Unit 1
- 103 Rockingham Rd Unit 2
- 76 Tsienneto Rd