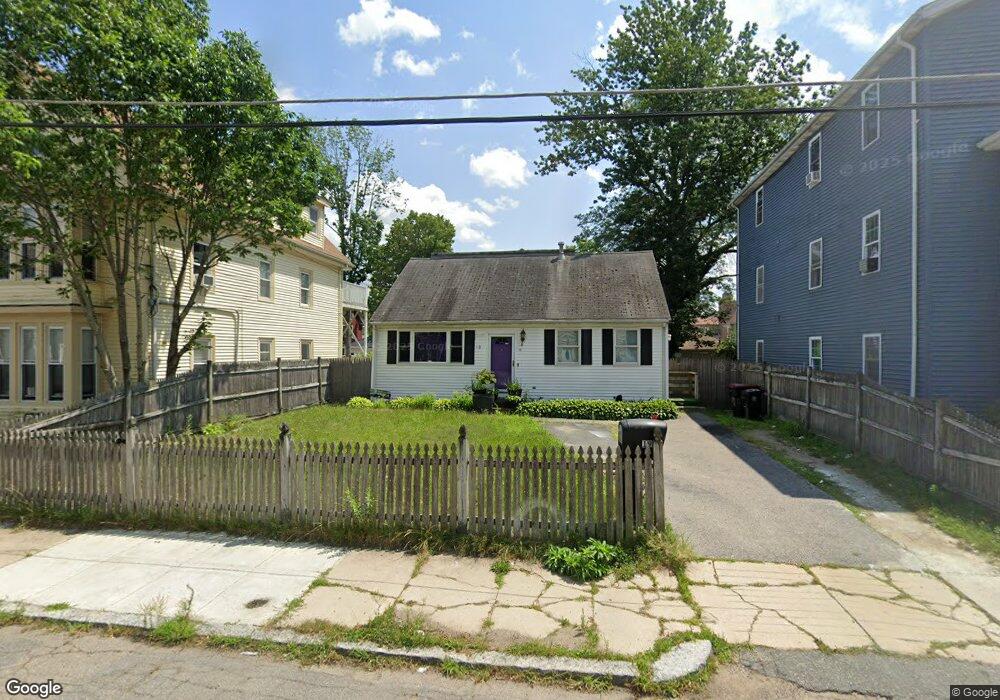
19 Grand St Brockton, MA 02301
Clifton Heights NeighborhoodEstimated Value: $376,000 - $505,000
3
Beds
1
Bath
952
Sq Ft
$477/Sq Ft
Est. Value
About This Home
This home is located at 19 Grand St, Brockton, MA 02301 and is currently estimated at $454,097, approximately $476 per square foot. 19 Grand St is a home located in Plymouth County with nearby schools including Davis K-8 School, John F. Kennedy Elementary School, and South Middle School.
Ownership History
Date
Name
Owned For
Owner Type
Purchase Details
Closed on
Aug 31, 2009
Sold by
Chase Home Finance Llc
Bought by
Depina Leila
Current Estimated Value
Home Financials for this Owner
Home Financials are based on the most recent Mortgage that was taken out on this home.
Original Mortgage
$127,187
Outstanding Balance
$83,095
Interest Rate
5.17%
Mortgage Type
Purchase Money Mortgage
Estimated Equity
$371,002
Purchase Details
Closed on
Jul 1, 2009
Sold by
Williams Lisha A
Bought by
Us Bk
Purchase Details
Closed on
Feb 19, 2004
Sold by
Monteiro Agnaldo P
Bought by
Allen Tracy M and Williams Lisha A
Purchase Details
Closed on
Mar 22, 2001
Sold by
Delphi Enterprises Inc
Bought by
Monteiro Agnaldo P
Purchase Details
Closed on
Jun 23, 2000
Sold by
Yusup Lucille
Bought by
Delphie Ent Inc
Purchase Details
Closed on
Sep 8, 1995
Sold by
Department Of Housing & Urban Dev
Bought by
Yusup Lucille
Purchase Details
Closed on
Jun 16, 1987
Sold by
Ioannilli Peter
Bought by
Dern Kevin
Create a Home Valuation Report for This Property
The Home Valuation Report is an in-depth analysis detailing your home's value as well as a comparison with similar homes in the area
Home Values in the Area
Average Home Value in this Area
Purchase History
| Date | Buyer | Sale Price | Title Company |
|---|---|---|---|
| Depina Leila | $130,000 | -- | |
| Us Bk | $89,267 | -- | |
| Allen Tracy M | $231,000 | -- | |
| Monteiro Agnaldo P | $125,000 | -- | |
| Delphie Ent Inc | $10,000 | -- | |
| Yusup Lucille | $1,004 | -- | |
| Dern Kevin | $23,235 | -- |
Source: Public Records
Mortgage History
| Date | Status | Borrower | Loan Amount |
|---|---|---|---|
| Open | Dern Kevin | $127,187 | |
| Previous Owner | Dern Kevin | $240,000 |
Source: Public Records
Tax History Compared to Growth
Tax History
| Year | Tax Paid | Tax Assessment Tax Assessment Total Assessment is a certain percentage of the fair market value that is determined by local assessors to be the total taxable value of land and additions on the property. | Land | Improvement |
|---|---|---|---|---|
| 2025 | $4,885 | $403,400 | $136,100 | $267,300 |
| 2024 | $4,779 | $397,600 | $136,100 | $261,500 |
| 2023 | $4,978 | $383,500 | $101,900 | $281,600 |
| 2022 | $4,409 | $315,600 | $92,400 | $223,200 |
| 2021 | $4,069 | $280,600 | $76,400 | $204,200 |
| 2020 | $4,116 | $271,700 | $72,000 | $199,700 |
| 2019 | $3,865 | $248,700 | $69,600 | $179,100 |
| 2018 | $3,511 | $218,600 | $69,600 | $149,000 |
| 2017 | $3,146 | $195,400 | $69,600 | $125,800 |
| 2016 | $3,338 | $192,300 | $67,400 | $124,900 |
| 2015 | $2,987 | $164,600 | $67,400 | $97,200 |
| 2014 | $2,906 | $160,300 | $67,400 | $92,900 |
Source: Public Records
Map
Nearby Homes
- 17 Grand St Unit 1
- 17 Grand St Unit 3
- 17 Grand St
- 17 Grand St Unit 2
- 17 Grand St Unit 1,2,3
- 21 Grand St
- 15 Grand St
- 15 Grand St Unit 2
- 827 Montello St
- 823 Montello St
- 24 E Nilsson St
- 20 E Nilsson St
- 835 Montello St
- 835 Montello St Unit 2
- 11 Grand St
- 20 Grand St
- 22 Grand St
- 22 Grand St Unit 3
- 809 Montello St
- 16 Grand St