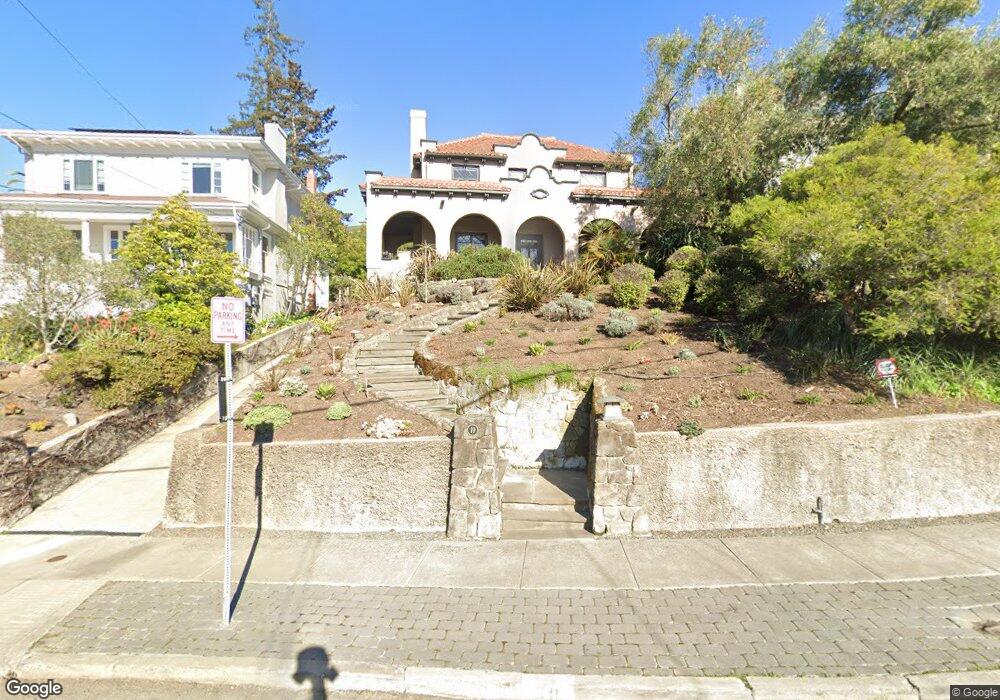
19 Hillcrest Rd Berkeley, CA 94705
Claremont NeighborhoodEstimated Value: $2,980,000 - $4,011,000
4
Beds
4
Baths
3,544
Sq Ft
$975/Sq Ft
Est. Value
About This Home
This home is located at 19 Hillcrest Rd, Berkeley, CA 94705 and is currently estimated at $3,456,688, approximately $975 per square foot. 19 Hillcrest Rd is a home located in Alameda County with nearby schools including John Muir Elementary School, Emerson Elementary School, and Malcolm X Elementary School.
Ownership History
Date
Name
Owned For
Owner Type
Purchase Details
Closed on
Feb 10, 2023
Sold by
Franklin Robert Scott and Franklin Jessica Maia
Bought by
Franklin Pitt 2023 Family Trust
Current Estimated Value
Purchase Details
Closed on
Nov 5, 2015
Sold by
Mok Clement and The Clement Mok Revocable Trus
Bought by
Franklin Robert Scott and Pitt Jessica Maia
Home Financials for this Owner
Home Financials are based on the most recent Mortgage that was taken out on this home.
Original Mortgage
$1,400,000
Interest Rate
3.81%
Mortgage Type
Purchase Money Mortgage
Purchase Details
Closed on
Oct 3, 2013
Sold by
Mok Clement
Bought by
Mok Clement and Clement Mok Revocable Trust
Purchase Details
Closed on
May 2, 1998
Sold by
Reasoner Edward A and Reasoner Alice D
Bought by
Mok Clement
Home Financials for this Owner
Home Financials are based on the most recent Mortgage that was taken out on this home.
Original Mortgage
$505,000
Interest Rate
7.05%
Create a Home Valuation Report for This Property
The Home Valuation Report is an in-depth analysis detailing your home's value as well as a comparison with similar homes in the area
Home Values in the Area
Average Home Value in this Area
Purchase History
| Date | Buyer | Sale Price | Title Company |
|---|---|---|---|
| Franklin Pitt 2023 Family Trust | -- | -- | |
| Franklin Robert Scott | $2,175,000 | Old Republic Title Company | |
| Mok Clement | -- | None Available | |
| Mok Clement | $710,000 | Chicago Title Co |
Source: Public Records
Mortgage History
| Date | Status | Borrower | Loan Amount |
|---|---|---|---|
| Previous Owner | Franklin Robert Scott | $1,400,000 | |
| Previous Owner | Mok Clement | $505,000 |
Source: Public Records
Tax History
| Year | Tax Paid | Tax Assessment Tax Assessment Total Assessment is a certain percentage of the fair market value that is determined by local assessors to be the total taxable value of land and additions on the property. | Land | Improvement |
|---|---|---|---|---|
| 2025 | $38,141 | $2,567,699 | $769,450 | $1,805,249 |
| 2024 | $38,141 | $2,517,218 | $754,364 | $1,769,854 |
| 2023 | $37,313 | $2,474,736 | $739,576 | $1,735,160 |
| 2022 | $36,844 | $2,419,212 | $725,075 | $1,701,137 |
| 2021 | $36,966 | $2,371,644 | $710,859 | $1,667,785 |
| 2020 | $35,145 | $2,354,263 | $703,573 | $1,650,690 |
| 2019 | $33,928 | $2,308,110 | $689,780 | $1,618,330 |
| 2018 | $33,362 | $2,262,870 | $676,260 | $1,586,610 |
| 2017 | $32,268 | $2,218,500 | $663,000 | $1,555,500 |
| 2016 | $31,344 | $2,175,000 | $650,000 | $1,525,000 |
| 2015 | $17,373 | $1,034,578 | $282,981 | $751,597 |
| 2014 | $16,960 | $1,014,314 | $277,438 | $736,876 |
Source: Public Records
Map
Nearby Homes
- 2962 Piedmont Ave
- 6100 Chabot Rd
- 360 Alcatraz Ave
- 204 El Camino Real
- 2477 Prince St
- 6189 Margarido Dr
- 6446 Colby St
- 5941 Keith Ave
- 5936 Broadway
- 2817 Palm Ct
- 1488 Alvarado Rd
- 2643 Stuart St
- 2935 Florence St
- 641 Alvarado Rd
- 0 Tunnel Rd
- 5883 Margarido Dr
- 2917 Telegraph Ave
- 190 Stonewall Rd
- 5668 Buena Vista Ave
- 45 Vicente Rd
- 25 Hillcrest Rd
- 15 Hillcrest Rd
- 29 Hillcrest Rd
- 35 Hillcrest Rd
- 2 Hillcrest Ct
- 6 Hillcrest Ct
- 10 Hillcrest Rd
- 10 Hillcrest Ct
- 6 Hillcrest Rd
- 20 Hillcrest Rd
- 9 Brookside Ave
- 24 Hillcrest Rd
- 3125 Claremont Ave
- 89 Hillcrest Rd
- 3131 Claremont Ave
- 3121 Claremont Ave
- 32 Hillcrest Rd
- 12 Hillcrest Ct
- 3135 Claremont Ave
- 3115 Claremont Ave
Your Personal Tour Guide
Ask me questions while you tour the home.