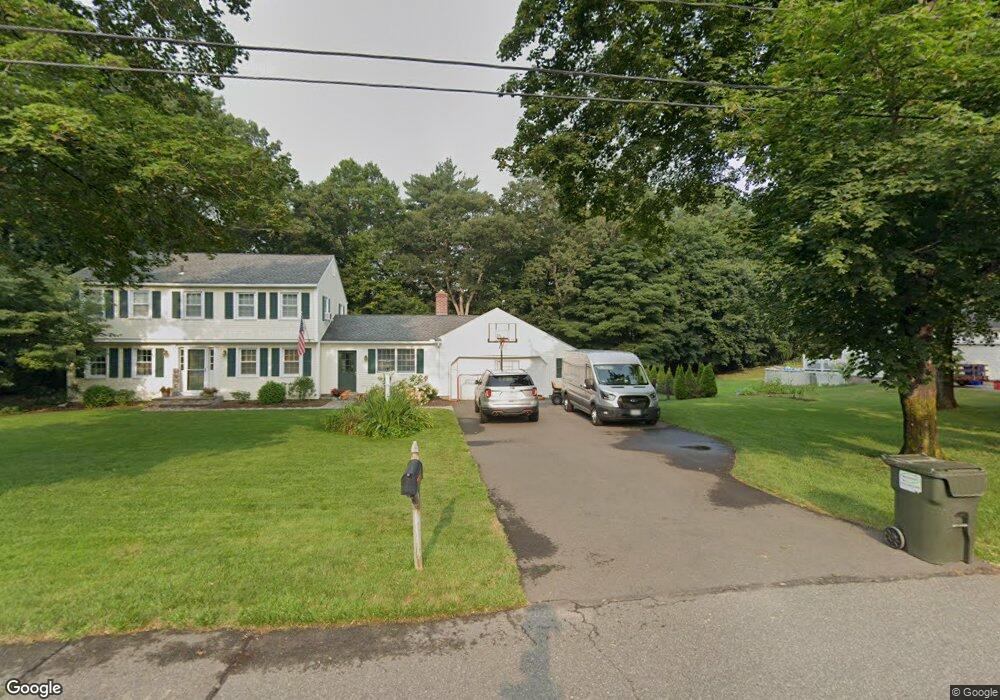
19 Longview Dr Wilbraham, MA 01095
Estimated Value: $514,399 - $619,000
4
Beds
3
Baths
2,100
Sq Ft
$266/Sq Ft
Est. Value
About This Home
This home is located at 19 Longview Dr, Wilbraham, MA 01095 and is currently estimated at $559,100, approximately $266 per square foot. 19 Longview Dr is a home located in Hampden County with nearby schools including Minnechaug Regional High School, Springfield International Charter School, and Wilbraham & Monson Academy.
Ownership History
Date
Name
Owned For
Owner Type
Purchase Details
Closed on
Oct 14, 2009
Sold by
Harrington Patricia D and Harrington Patricia C
Bought by
Costello David B and Costello Nicole R
Current Estimated Value
Home Financials for this Owner
Home Financials are based on the most recent Mortgage that was taken out on this home.
Original Mortgage
$313,222
Outstanding Balance
$205,155
Interest Rate
5.14%
Mortgage Type
Purchase Money Mortgage
Estimated Equity
$353,945
Create a Home Valuation Report for This Property
The Home Valuation Report is an in-depth analysis detailing your home's value as well as a comparison with similar homes in the area
Home Values in the Area
Average Home Value in this Area
Purchase History
| Date | Buyer | Sale Price | Title Company |
|---|---|---|---|
| Costello David B | $319,000 | -- |
Source: Public Records
Mortgage History
| Date | Status | Borrower | Loan Amount |
|---|---|---|---|
| Open | Costello David B | $313,222 |
Source: Public Records
Tax History
| Year | Tax Paid | Tax Assessment Tax Assessment Total Assessment is a certain percentage of the fair market value that is determined by local assessors to be the total taxable value of land and additions on the property. | Land | Improvement |
|---|---|---|---|---|
| 2025 | $7,855 | $439,300 | $97,400 | $341,900 |
| 2024 | $7,888 | $426,400 | $97,400 | $329,000 |
| 2023 | $7,003 | $379,300 | $97,400 | $281,900 |
| 2022 | $7,003 | $341,800 | $97,400 | $244,400 |
| 2021 | $6,622 | $288,400 | $104,700 | $183,700 |
| 2020 | $6,454 | $288,400 | $104,700 | $183,700 |
| 2019 | $6,289 | $288,500 | $104,700 | $183,800 |
| 2018 | $6,274 | $277,100 | $104,700 | $172,400 |
| 2017 | $6,096 | $277,100 | $104,700 | $172,400 |
| 2016 | $5,776 | $267,400 | $116,100 | $151,300 |
| 2015 | $5,583 | $267,400 | $116,100 | $151,300 |
Source: Public Records
Map
Nearby Homes
- 6 Katie St
- 24 Mcintosh Dr
- 230V Burleigh Rd
- 5 Edgewood Rd
- 85 Baldwin Dr
- 107 Baldwin Dr
- 25 Angelica Dr
- 140 Slumber Ln
- 23 Rachael St
- 34 Flora St
- 6 Brooklawn Rd
- 301 Tinkham Rd
- 16 Deerfoot Dr
- 8 Patriot Ridge Ln
- 46 Holland Dr
- 592 Stony Hill Rd
- 15 Pine Acre Rd
- 325 Allen St
- 6 Hilltop Park
- 17 Jeanne Marie St
Your Personal Tour Guide
Ask me questions while you tour the home.