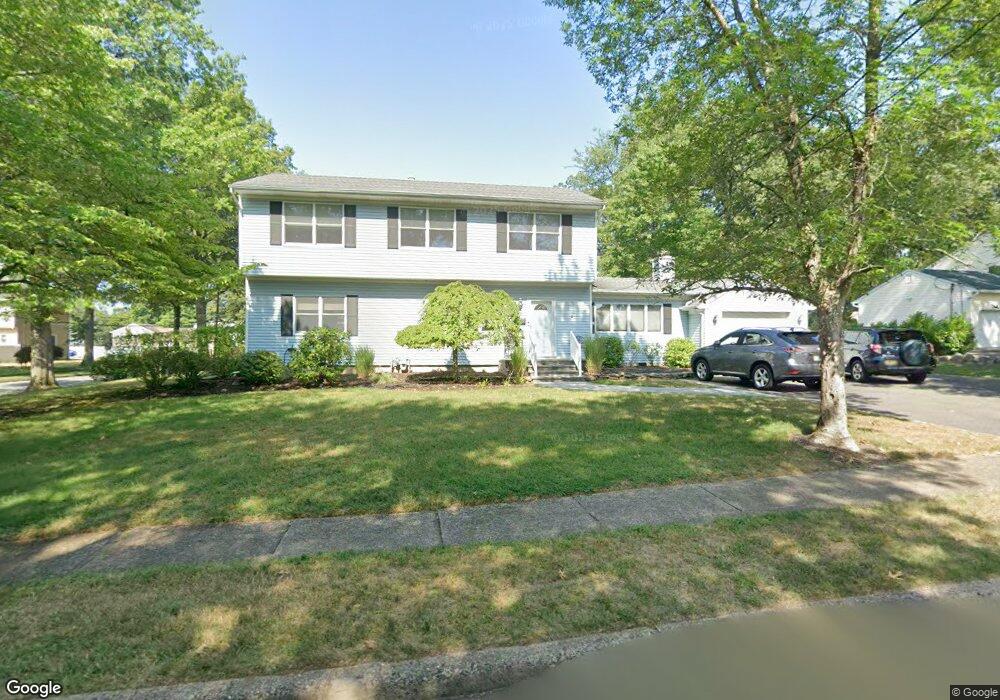
19 Lyncrest Dr Paramus, NJ 07652
Estimated Value: $952,914 - $1,147,000
Studio
--
Bath
2,130
Sq Ft
$480/Sq Ft
Est. Value
About This Home
This home is located at 19 Lyncrest Dr, Paramus, NJ 07652 and is currently estimated at $1,022,479, approximately $480 per square foot. 19 Lyncrest Dr is a home located in Bergen County with nearby schools including Paramus High School and Alpine Learning Group.
Ownership History
Date
Name
Owned For
Owner Type
Purchase Details
Closed on
Oct 28, 2016
Sold by
Demirdjian John and Demirdjian Cristina A
Bought by
Kupfer Warren and Kupfer Michelle
Current Estimated Value
Home Financials for this Owner
Home Financials are based on the most recent Mortgage that was taken out on this home.
Original Mortgage
$300,000
Outstanding Balance
$240,848
Interest Rate
3.42%
Mortgage Type
New Conventional
Estimated Equity
$781,631
Purchase Details
Closed on
Dec 6, 2010
Sold by
Katz David and Mercer Carla
Bought by
Demirdjian John and Demirdjian Cristina A
Home Financials for this Owner
Home Financials are based on the most recent Mortgage that was taken out on this home.
Original Mortgage
$416,000
Interest Rate
4.37%
Mortgage Type
Purchase Money Mortgage
Purchase Details
Closed on
Oct 27, 2003
Sold by
Dahms Maureen
Bought by
Katz David and Katz Carla
Home Financials for this Owner
Home Financials are based on the most recent Mortgage that was taken out on this home.
Original Mortgage
$37,900
Interest Rate
5.98%
Create a Home Valuation Report for This Property
The Home Valuation Report is an in-depth analysis detailing your home's value as well as a comparison with similar homes in the area
Home Values in the Area
Average Home Value in this Area
Purchase History
| Date | Buyer | Sale Price | Title Company |
|---|---|---|---|
| Kupfer Warren | $615,000 | Title Insurance Commitment | |
| Demirdjian John | $520,000 | -- | |
| Katz David | $479,000 | -- |
Source: Public Records
Mortgage History
| Date | Status | Borrower | Loan Amount |
|---|---|---|---|
| Open | Kupfer Warren | $300,000 | |
| Previous Owner | Demirdjian John | $416,000 | |
| Previous Owner | Katz David | $37,900 |
Source: Public Records
Tax History
| Year | Tax Paid | Tax Assessment Tax Assessment Total Assessment is a certain percentage of the fair market value that is determined by local assessors to be the total taxable value of land and additions on the property. | Land | Improvement |
|---|---|---|---|---|
| 2025 | $11,406 | $803,800 | $400,100 | $403,700 |
| 2024 | $11,080 | $753,400 | $371,000 | $382,400 |
| 2023 | $10,512 | $722,300 | $353,900 | $368,400 |
| 2022 | $10,512 | $677,300 | $330,800 | $346,500 |
| 2021 | $10,256 | $620,100 | $301,600 | $318,500 |
| 2020 | $9,656 | $605,400 | $291,600 | $313,800 |
| 2019 | $9,783 | $527,100 | $258,500 | $268,600 |
| 2018 | $9,662 | $527,100 | $258,500 | $268,600 |
| 2017 | $9,493 | $527,100 | $258,500 | $268,600 |
| 2016 | $9,235 | $527,100 | $258,500 | $268,600 |
| 2015 | $9,140 | $527,100 | $258,500 | $268,600 |
| 2014 | $9,061 | $523,600 | $258,500 | $265,100 |
Source: Public Records
Map
Nearby Homes
- 801 Godwin Rd
- 779 Decker Place
- 33 Oliver Rd
- 780 Hilton Place
- 1153 Linwood Ave
- 65 Edgewood Dr
- 743 Boyd Rd
- 18 Vermont Dr
- 715 Bush Place
- 80 Ridgewood Rd Unit 106
- 947 E Glen Ave
- 101 Glen Ave
- 82 Azalea St
- 828 Pascack Rd
- 86 Azalea St
- 111 Crain Rd
- 141 Pond Dr Unit 14A
- 648 Falmouth Ave
- 295 Georgian Dr
- 133 Morristown Place
Your Personal Tour Guide
Ask me questions while you tour the home.