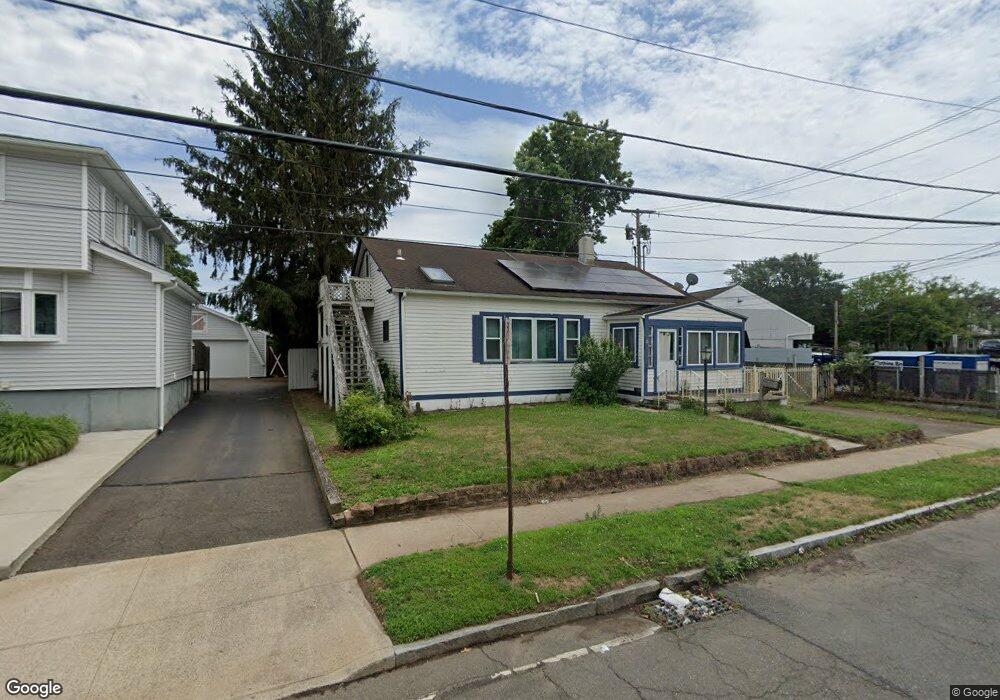
19 Morris Causeway New Haven, CT 06512
East Shore NeighborhoodEstimated Value: $247,000 - $359,000
2
Beds
2
Baths
2,062
Sq Ft
$136/Sq Ft
Est. Value
About This Home
This home is located at 19 Morris Causeway, New Haven, CT 06512 and is currently estimated at $280,287, approximately $135 per square foot. 19 Morris Causeway is a home located in New Haven County with nearby schools including Cold Spring School and Pathway School.
Ownership History
Date
Name
Owned For
Owner Type
Purchase Details
Closed on
Mar 19, 2014
Sold by
Wrightington Donna M
Bought by
Wrightington Ernest C
Current Estimated Value
Purchase Details
Closed on
May 11, 2011
Sold by
Wrightington Ernest C
Bought by
Wrightington Donna and Wrightington Ernest C
Purchase Details
Closed on
Feb 12, 2010
Sold by
Sylla Abodulaye and Sylla Laurie
Bought by
Wrightington Ernest
Purchase Details
Closed on
Jun 26, 2002
Sold by
Taft Christopher
Bought by
Sylla Laurie
Purchase Details
Closed on
May 24, 2000
Sold by
Nagy Susan E
Bought by
Taft Christopher
Purchase Details
Closed on
Jun 30, 1999
Sold by
Lynch Helen M and Lucibello Lorene A
Bought by
Nagy Susan E
Purchase Details
Closed on
May 1, 1997
Sold by
Trentini Charles L and Trentini Cheryl A
Bought by
Lynch Helene M and Ours Lorene A
Create a Home Valuation Report for This Property
The Home Valuation Report is an in-depth analysis detailing your home's value as well as a comparison with similar homes in the area
Home Values in the Area
Average Home Value in this Area
Purchase History
| Date | Buyer | Sale Price | Title Company |
|---|---|---|---|
| Wrightington Ernest C | -- | -- | |
| Wrightington Donna | -- | -- | |
| Wrightington Ernest | $170,000 | -- | |
| Sylla Laurie | $157,000 | -- | |
| Taft Christopher | $142,000 | -- | |
| Nagy Susan E | $120,000 | -- | |
| Lynch Helene M | $105,000 | -- |
Source: Public Records
Mortgage History
| Date | Status | Borrower | Loan Amount |
|---|---|---|---|
| Open | Lynch Helene M | $1,462 | |
| Open | Lynch Helene M | $161,367 |
Source: Public Records
Tax History Compared to Growth
Tax History
| Year | Tax Paid | Tax Assessment Tax Assessment Total Assessment is a certain percentage of the fair market value that is determined by local assessors to be the total taxable value of land and additions on the property. | Land | Improvement |
|---|---|---|---|---|
| 2025 | $7,022 | $178,220 | $63,420 | $114,800 |
| 2024 | $6,861 | $178,220 | $63,420 | $114,800 |
| 2023 | $6,630 | $178,220 | $63,420 | $114,800 |
| 2022 | $7,084 | $178,220 | $63,420 | $114,800 |
| 2021 | $5,538 | $126,210 | $41,160 | $85,050 |
| 2020 | $5,538 | $126,210 | $41,160 | $85,050 |
| 2019 | $5,425 | $126,210 | $41,160 | $85,050 |
| 2018 | $5,425 | $126,210 | $41,160 | $85,050 |
| 2017 | $4,882 | $126,210 | $41,160 | $85,050 |
| 2016 | $5,032 | $121,100 | $40,320 | $80,780 |
| 2015 | $5,032 | $121,100 | $40,320 | $80,780 |
| 2014 | $5,032 | $121,100 | $40,320 | $80,780 |
Source: Public Records
Map
Nearby Homes
- 50 Concord St
- 60 Townsend Ave
- 75 Townsend Ave
- 34 Beecher Place
- 114 Cove St
- 119 Cove St
- 280 Marion St
- 86 Cove St
- 26 Nelson St
- 44 Meadow View Rd
- 20 Ira St
- 1820 Dean St
- 3 Stoddard Rd
- 52 Stuyvesant Ave
- 2 Old Town Hwy Unit 39
- 384 Silver Sands Rd
- 380 Silver Sands Rd
- 166 Beach Ave
- 385 Coe Ave Unit 1
- 375 Coe Ave Unit 22
- 25 Morris Causeway
- 31 Morris Causeway
- 0 Concord St
- 21 Townsend Ave
- 19 Townsend Ave
- 39 Morris Causeway
- 7 Concord St
- 27 Townsend Ave
- 17 Townsend Ave
- 29 Townsend Ave
- 32 Morris Causeway
- 32 Morris Causeway Unit 2
- 9 Concord St
- 33 Townsend Ave
- 22 Townsend Ave
- 499 Lighthouse Rd
- 15 Townsend Ave
- 20 Townsend Ave
- 23 Concord St
- 38 Morris Causeway