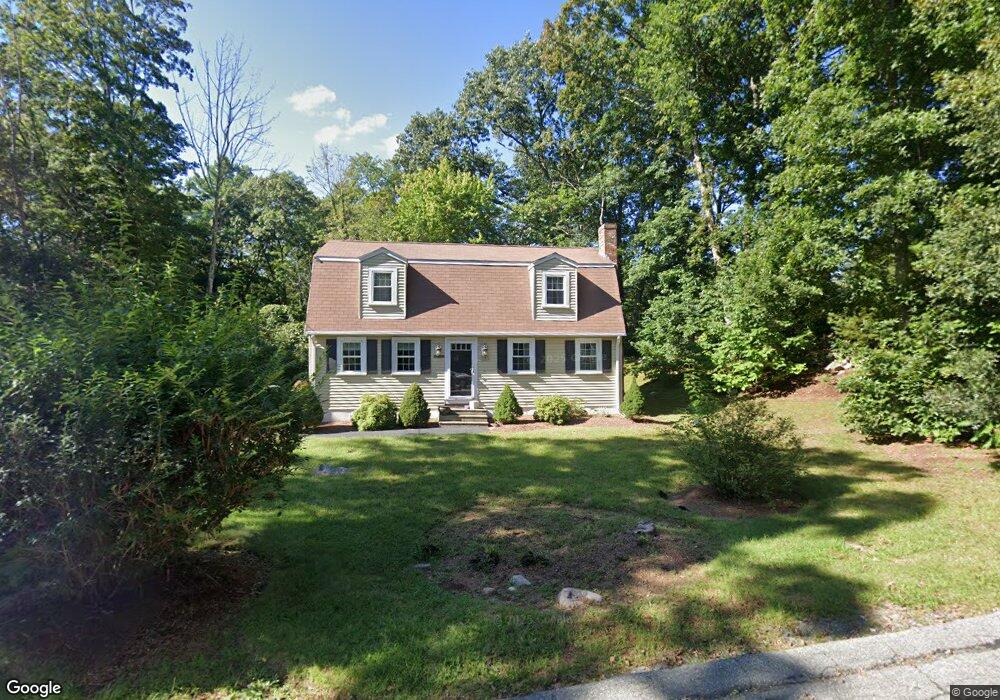
19 Mount St Franklin, MA 02038
Wadsworth NeighborhoodEstimated Value: $606,000 - $666,000
4
Beds
2
Baths
1,685
Sq Ft
$377/Sq Ft
Est. Value
About This Home
This home is located at 19 Mount St, Franklin, MA 02038 and is currently estimated at $635,210, approximately $376 per square foot. 19 Mount St is a home located in Norfolk County with nearby schools including Gerald M. Parmenter Elementary School, Remington Middle School, and Franklin High School.
Ownership History
Date
Name
Owned For
Owner Type
Purchase Details
Closed on
Feb 4, 2009
Sold by
Malpaso Creek Re Inv
Bought by
Ives Courtney P and Ives Kyle
Current Estimated Value
Home Financials for this Owner
Home Financials are based on the most recent Mortgage that was taken out on this home.
Original Mortgage
$310,337
Outstanding Balance
$197,218
Interest Rate
5.2%
Mortgage Type
Purchase Money Mortgage
Estimated Equity
$437,992
Purchase Details
Closed on
Mar 3, 2008
Sold by
Kelly Brian G and Kelly Judith M
Bought by
Malpaso Creek Re Inv
Purchase Details
Closed on
Oct 10, 2007
Sold by
Greim Lindsey A and Hunt Lindsey A
Bought by
Kelly Brian G and Kelly Judith M
Home Financials for this Owner
Home Financials are based on the most recent Mortgage that was taken out on this home.
Original Mortgage
$255,150
Interest Rate
6.49%
Mortgage Type
Purchase Money Mortgage
Create a Home Valuation Report for This Property
The Home Valuation Report is an in-depth analysis detailing your home's value as well as a comparison with similar homes in the area
Home Values in the Area
Average Home Value in this Area
Purchase History
| Date | Buyer | Sale Price | Title Company |
|---|---|---|---|
| Ives Courtney P | $325,000 | -- | |
| Malpaso Creek Re Inv | -- | -- | |
| Kelly Brian G | $283,500 | -- |
Source: Public Records
Mortgage History
| Date | Status | Borrower | Loan Amount |
|---|---|---|---|
| Open | Ives Courtney P | $310,337 | |
| Previous Owner | Kelly Brian G | $255,150 |
Source: Public Records
Tax History
| Year | Tax Paid | Tax Assessment Tax Assessment Total Assessment is a certain percentage of the fair market value that is determined by local assessors to be the total taxable value of land and additions on the property. | Land | Improvement |
|---|---|---|---|---|
| 2025 | $6,798 | $585,000 | $257,900 | $327,100 |
| 2024 | $6,049 | $513,100 | $257,900 | $255,200 |
| 2023 | $6,189 | $492,000 | $260,000 | $232,000 |
| 2022 | $5,887 | $419,000 | $214,900 | $204,100 |
| 2021 | $5,664 | $386,600 | $230,200 | $156,400 |
| 2020 | $5,525 | $380,800 | $232,200 | $148,600 |
| 2019 | $5,263 | $359,000 | $210,400 | $148,600 |
| 2018 | $5,116 | $349,200 | $216,300 | $132,900 |
| 2017 | $4,832 | $331,400 | $198,500 | $132,900 |
| 2016 | $4,483 | $309,200 | $195,500 | $113,700 |
| 2015 | $4,517 | $304,400 | $190,700 | $113,700 |
| 2014 | $3,958 | $273,900 | $160,200 | $113,700 |
Source: Public Records
Map
Nearby Homes
Your Personal Tour Guide
Ask me questions while you tour the home.