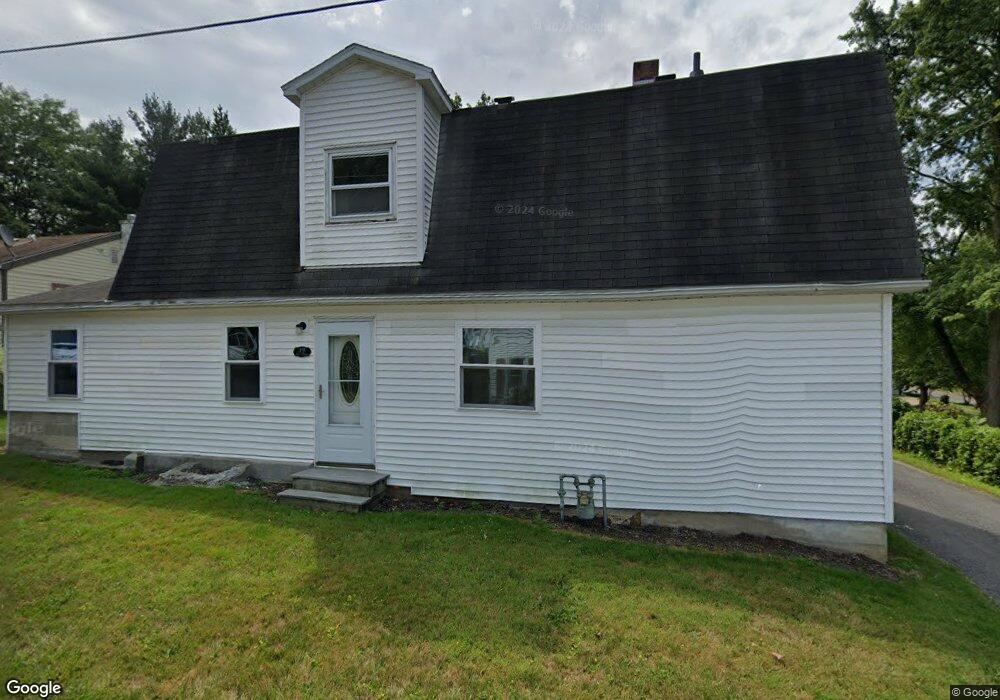
19 North St Jeromesville, OH 44840
Estimated Value: $131,260 - $216,000
3
Beds
2
Baths
1,651
Sq Ft
$115/Sq Ft
Est. Value
About This Home
This home is located at 19 North St, Jeromesville, OH 44840 and is currently estimated at $189,815, approximately $114 per square foot. 19 North St is a home located in Ashland County with nearby schools including Hillsdale Elementary School, Hillsdale Middle School, and Hillsdale High School.
Ownership History
Date
Name
Owned For
Owner Type
Purchase Details
Closed on
Aug 31, 2021
Sold by
Cbs Holdings Ltd Inc
Bought by
Farraro Emily M and Farraro Anthony
Current Estimated Value
Home Financials for this Owner
Home Financials are based on the most recent Mortgage that was taken out on this home.
Original Mortgage
$96,000
Outstanding Balance
$87,215
Interest Rate
2.84%
Mortgage Type
Construction
Estimated Equity
$102,600
Purchase Details
Closed on
Jan 18, 2013
Sold by
Federal Home Loan Mtg Corp
Bought by
Cbs Holdings Ltd
Purchase Details
Closed on
Mar 4, 2011
Bought by
Soles Brent
Purchase Details
Closed on
Oct 26, 2010
Sold by
Byler Brent E and Byler Kimberly A
Purchase Details
Closed on
Nov 7, 2005
Sold by
Cutlip Lawrence E
Bought by
Byler Brent E
Purchase Details
Closed on
Jul 21, 1975
Bought by
Cutlip Lawrence E
Create a Home Valuation Report for This Property
The Home Valuation Report is an in-depth analysis detailing your home's value as well as a comparison with similar homes in the area
Home Values in the Area
Average Home Value in this Area
Purchase History
| Date | Buyer | Sale Price | Title Company |
|---|---|---|---|
| Farraro Emily M | $125,000 | American Homeland Title | |
| Cbs Holdings Ltd | -- | -- | |
| Soles Brent | $25,000 | -- | |
| -- | $37,300 | -- | |
| Byler Brent E | $72,000 | -- | |
| Cutlip Lawrence E | $5,500 | -- |
Source: Public Records
Mortgage History
| Date | Status | Borrower | Loan Amount |
|---|---|---|---|
| Open | Farraro Emily M | $96,000 |
Source: Public Records
Tax History Compared to Growth
Tax History
| Year | Tax Paid | Tax Assessment Tax Assessment Total Assessment is a certain percentage of the fair market value that is determined by local assessors to be the total taxable value of land and additions on the property. | Land | Improvement |
|---|---|---|---|---|
| 2024 | $1,148 | $34,120 | $5,810 | $28,310 |
| 2023 | $1,148 | $34,120 | $5,810 | $28,310 |
| 2022 | $1,133 | $25,090 | $4,270 | $20,820 |
| 2021 | $1,162 | $25,090 | $4,270 | $20,820 |
| 2020 | $1,096 | $25,090 | $4,270 | $20,820 |
| 2019 | $845 | $18,810 | $3,670 | $15,140 |
| 2018 | $822 | $18,810 | $3,670 | $15,140 |
| 2017 | $821 | $18,810 | $3,670 | $15,140 |
| 2016 | $786 | $17,920 | $3,500 | $14,420 |
| 2015 | $777 | $17,920 | $3,500 | $14,420 |
| 2013 | $835 | $18,640 | $3,500 | $15,140 |
Source: Public Records
Map
Nearby Homes
- 14 E South St
- 144 Township Road 1650
- 1845 County Road 655
- 2057 Ohio 89
- 2057 State Route 89
- 150 E Main St
- 0 Ashland County Road 2175
- 0 Ashland County Road 2175
- 2289 N Reedsburg Rd
- 1346 Ohio 89
- 10610 W Old Lincoln Way Unit 6201 Newkirk Rd.
- 1346 State Route 89
- 156 U S 250
- 1653 State Route 60
- 1653 Ohio 60
- 203 County Road 1302
- 112 Ohio 95
- 0 Twp Rd 1806 Unit 11591470
- 820 County Road 30a
- 1446 Township Road 805