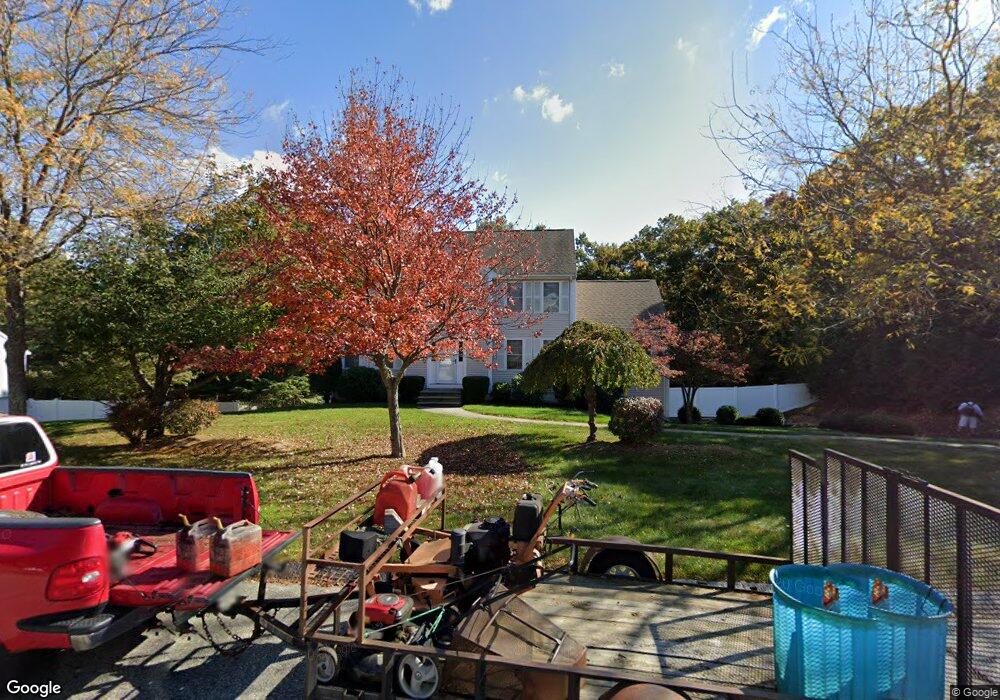
19 Padden Rd Franklin, MA 02038
Estimated Value: $869,756 - $1,026,000
4
Beds
3
Baths
2,368
Sq Ft
$393/Sq Ft
Est. Value
About This Home
This home is located at 19 Padden Rd, Franklin, MA 02038 and is currently estimated at $930,939, approximately $393 per square foot. 19 Padden Rd is a home located in Norfolk County with nearby schools including Helen Keller Elementary School, Annie Sullivan Middle School, and Franklin High School.
Ownership History
Date
Name
Owned For
Owner Type
Purchase Details
Closed on
Jul 25, 2001
Sold by
Coppola Ronald and Coppola Karin A
Bought by
Masterson Kevin F
Current Estimated Value
Home Financials for this Owner
Home Financials are based on the most recent Mortgage that was taken out on this home.
Original Mortgage
$330,400
Interest Rate
7.18%
Mortgage Type
Purchase Money Mortgage
Purchase Details
Closed on
Aug 7, 1998
Sold by
Hunter Bldg Corp
Bought by
Coppola Ronald and Coppola Karin A
Home Financials for this Owner
Home Financials are based on the most recent Mortgage that was taken out on this home.
Original Mortgage
$164,900
Interest Rate
6.92%
Mortgage Type
Purchase Money Mortgage
Create a Home Valuation Report for This Property
The Home Valuation Report is an in-depth analysis detailing your home's value as well as a comparison with similar homes in the area
Home Values in the Area
Average Home Value in this Area
Purchase History
| Date | Buyer | Sale Price | Title Company |
|---|---|---|---|
| Masterson Kevin F | $413,000 | -- | |
| Coppola Ronald | $259,900 | -- |
Source: Public Records
Mortgage History
| Date | Status | Borrower | Loan Amount |
|---|---|---|---|
| Open | Coppola Ronald | $380,000 | |
| Closed | Coppola Ronald | $330,400 | |
| Previous Owner | Coppola Ronald | $25,000 | |
| Previous Owner | Coppola Ronald | $164,900 |
Source: Public Records
Tax History Compared to Growth
Tax History
| Year | Tax Paid | Tax Assessment Tax Assessment Total Assessment is a certain percentage of the fair market value that is determined by local assessors to be the total taxable value of land and additions on the property. | Land | Improvement |
|---|---|---|---|---|
| 2025 | $8,559 | $736,600 | $327,000 | $409,600 |
| 2024 | $8,255 | $700,200 | $327,000 | $373,200 |
| 2023 | $8,268 | $657,200 | $284,000 | $373,200 |
| 2022 | $7,643 | $544,000 | $215,100 | $328,900 |
| 2021 | $8,034 | $548,400 | $239,100 | $309,300 |
| 2020 | $7,506 | $517,300 | $223,300 | $294,000 |
| 2019 | $7,468 | $509,400 | $215,400 | $294,000 |
| 2018 | $6,956 | $474,800 | $211,400 | $263,400 |
| 2017 | $6,721 | $461,000 | $197,600 | $263,400 |
| 2016 | $6,632 | $457,400 | $200,400 | $257,000 |
| 2015 | $6,711 | $452,200 | $195,200 | $257,000 |
| 2014 | $6,187 | $428,200 | $171,200 | $257,000 |
Source: Public Records
Map
Nearby Homes
- 266 Pleasant St
- 324 Pleasant St
- 150 Pleasant St
- 48 Pinehurst St
- 17 Longhill Rd
- 204 Lincoln St
- 14 Pleasant St Unit A
- 76 Dean Ave
- 67 Milliken Ave Unit 22
- 0 Upper Union St Unit 73230551
- 159 E Central St
- 90 E Central St Unit 103
- 90 E Central St Unit 106
- 90 E Central St Unit 304
- 90 E Central St Unit 202
- 90 E Central St Unit 105
- 90 E Central St Unit 301
- 120 Union St Unit 1
- 1 Uncas Ave
- 2 Kayla Dr
- 0 Lot 17 Padden Rd Unit 50481425
- 15 Padden Rd
- 23 Padden Rd
- 0 Lot 18 Padden Rd Unit 50481426
- 20 Padden Rd
- 26 Padden Rd
- 0 Lot 13 Padden Rd Unit 50481069
- 16 Padden Rd
- 27 Padden Rd
- 0 Lot 14 Padden Rd Unit 50481067
- 11 Padden Rd
- 32 Padden Rd
- 258 Pleasant St
- 27 Philomena Way
- 248 Pleasant St
- 12 Padden Rd
- 31 Padden Rd
- 0 L0t 9 Padden Rd Unit 50481068
- 23 Philomena Way
- 31 Philomena Way