
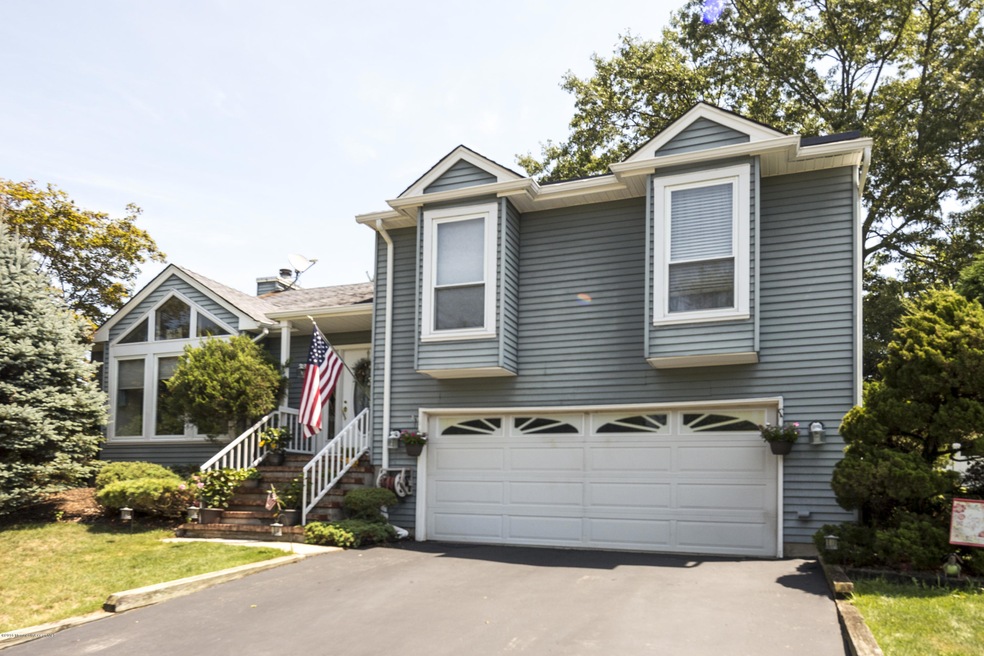

19 Reed Rd Howell, NJ 07731
Southard Neighborhood
4
Beds
3
Baths
2,354
Sq Ft
7,841
Sq Ft Lot
Highlights
- Spa
- Deck
- 1 Fireplace
- Howell High School Rated A-
- Marble Flooring
- No HOA
About This Home
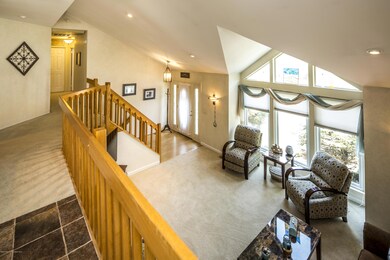
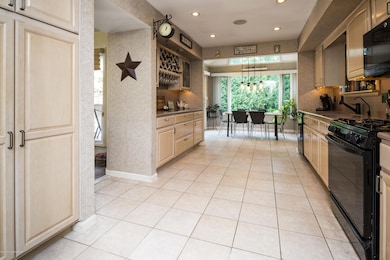
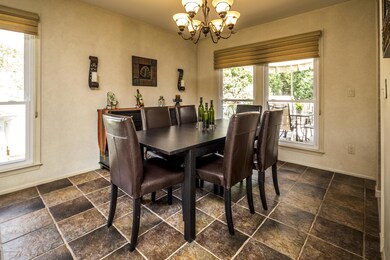
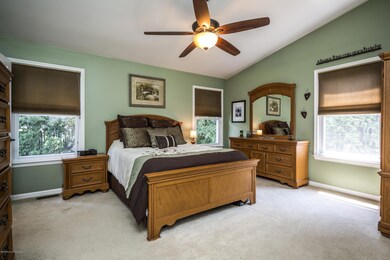
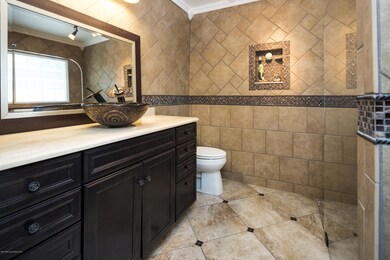
As of August 2021Heritage Point solar powered extended split with 4 bedrooms, 3 full baths, 2 car garage and updates galore. Massive updated kitchen with breakfast nook and sliders to Treks deck. Updated baths. A mix of flooring including marble, hardwoods, laminates, ceramic tile and carpet. Decorative moldings, recessed lighting, audio system. Lower level has large family room with separate gas heat and wood burning fireplace. Gym room too! Large MBR with large walk in closet adjoins to European style Italian porcelain bathroom. Professionally landscaped yard with shed, inground sprinklers, multiple decks, hot tub and natural gas grill. Private neighborhood and park like setting across the street. Solar panels on the roof cut down on electric bills and offer a clean energy alternative. See Photos!
Last Agent to Sell the Property
Daniel Wright
RE/MAX Elite Listed on: 07/26/2016
Home Details
Home Type
- Single Family
Est. Annual Taxes
- $9,258
Year Built
- Built in 1985
Lot Details
- Lot Dimensions are 75 x 106
- Sprinkler System
Parking
- 2 Car Direct Access Garage
Home Design
- Split Level Home
- Asphalt Rolled Roof
- Aluminum Siding
Interior Spaces
- 2,354 Sq Ft Home
- 3-Story Property
- 1 Fireplace
- Entrance Foyer
- Family Room
- Living Room
- Breakfast Room
- Dining Room
- Home Gym
- Crawl Space
- Laundry Room
Kitchen
- Self-Cleaning Oven
- Gas Cooktop
- Microwave
- Dishwasher
Flooring
- Wood
- Laminate
- Marble
Bedrooms and Bathrooms
- 4 Bedrooms
- Primary bedroom located on third floor
- 3 Full Bathrooms
Outdoor Features
- Spa
- Deck
- Storage Shed
- Outdoor Gas Grill
Schools
- Howell North Middle School
- Howell High School
Utilities
- Forced Air Heating and Cooling System
- Heating System Uses Natural Gas
- Natural Gas Water Heater
Community Details
- No Home Owners Association
- Heritage Point Subdivision
Listing and Financial Details
- Assessor Parcel Number 21-00078-02-00009
Ownership History
Date
Name
Owned For
Owner Type
Purchase Details
Listed on
Jun 5, 2021
Closed on
Aug 4, 2021
Sold by
Gohil Nayanaben and Gohil Milanbhal
Bought by
Libutti Anthony M and Hogan Meghan
Seller's Agent
Jennifer Binkley
RE/MAX New Beginnings Realty-Toms River
Buyer's Agent
Melissa Tackney
Coldwell Banker Realty
List Price
$450,000
Sold Price
$490,000
Premium/Discount to List
$40,000
8.89%
Current Estimated Value
Home Financials for this Owner
Home Financials are based on the most recent Mortgage that was taken out on this home.
Estimated Appreciation
$253,781
Avg. Annual Appreciation
11.17%
Original Mortgage
$465,500
Outstanding Balance
$428,395
Interest Rate
3%
Mortgage Type
New Conventional
Estimated Equity
$315,386
Purchase Details
Listed on
Jul 26, 2016
Closed on
Oct 6, 2016
Sold by
Hogan Kendra and Hogan Jacqueline
Bought by
Gohill Nayanaben
Seller's Agent
Daniel Wright
RE/MAX Elite
Buyer's Agent
Maria Sitoy
EXP Realty
Sold Price
$378,000
Home Financials for this Owner
Home Financials are based on the most recent Mortgage that was taken out on this home.
Avg. Annual Appreciation
5.57%
Original Mortgage
$230,000
Interest Rate
3.48%
Mortgage Type
New Conventional
Purchase Details
Closed on
Aug 26, 2011
Sold by
Bleiweis Mark and Ippolito Nancy
Bought by
Hogan Kendra and Hogan Jacqueline
Home Financials for this Owner
Home Financials are based on the most recent Mortgage that was taken out on this home.
Original Mortgage
$313,302
Interest Rate
4.25%
Mortgage Type
FHA
Purchase Details
Closed on
Jan 17, 2001
Sold by
Digiuseppi Stephen
Bought by
Bleiweis Mark and Bleiweis Nancy
Home Financials for this Owner
Home Financials are based on the most recent Mortgage that was taken out on this home.
Original Mortgage
$223,000
Interest Rate
7.52%
Similar Homes in the area
Create a Home Valuation Report for This Property
The Home Valuation Report is an in-depth analysis detailing your home's value as well as a comparison with similar homes in the area
Home Values in the Area
Average Home Value in this Area
Purchase History
| Date | Type | Sale Price | Title Company |
|---|---|---|---|
| Deed | $490,000 | Clear To Close Title | |
| Deed | $378,000 | Coastal Title | |
| Deed | $330,000 | Magellan Title & Abstract Ll | |
| Deed | $267,000 | -- |
Source: Public Records
Mortgage History
| Date | Status | Loan Amount | Loan Type |
|---|---|---|---|
| Open | $465,500 | New Conventional | |
| Previous Owner | $230,000 | New Conventional | |
| Previous Owner | $313,302 | FHA | |
| Previous Owner | $50,000 | Unknown | |
| Previous Owner | $223,000 | No Value Available |
Source: Public Records
Property History
| Date | Event | Price | Change | Sq Ft Price |
|---|---|---|---|---|
| 08/06/2021 08/06/21 | Sold | $490,000 | +8.9% | $208 / Sq Ft |
| 06/15/2021 06/15/21 | Pending | -- | -- | -- |
| 06/05/2021 06/05/21 | For Sale | $450,000 | +19.0% | $191 / Sq Ft |
| 10/21/2016 10/21/16 | Sold | $378,000 | -- | $161 / Sq Ft |
Source: MOREMLS (Monmouth Ocean Regional REALTORS®)
Tax History Compared to Growth
Tax History
| Year | Tax Paid | Tax Assessment Tax Assessment Total Assessment is a certain percentage of the fair market value that is determined by local assessors to be the total taxable value of land and additions on the property. | Land | Improvement |
|---|---|---|---|---|
| 2024 | $11,200 | $643,300 | $323,200 | $320,100 |
| 2023 | $11,200 | $601,800 | $289,200 | $312,600 |
| 2022 | $10,208 | $490,000 | $169,200 | $320,800 |
| 2021 | $10,208 | $444,600 | $159,200 | $285,400 |
| 2020 | $10,365 | $446,400 | $164,200 | $282,200 |
| 2019 | $10,091 | $426,500 | $149,200 | $277,300 |
| 2018 | $9,848 | $413,600 | $149,200 | $264,400 |
| 2017 | $9,384 | $389,700 | $133,300 | $256,400 |
| 2016 | $9,283 | $381,700 | $131,800 | $249,900 |
| 2015 | $9,258 | $376,800 | $133,300 | $243,500 |
| 2014 | $8,389 | $316,800 | $123,300 | $193,500 |
Source: Public Records
Agents Affiliated with this Home
-
J
Seller's Agent in 2021
Jennifer Binkley
RE/MAX
-
Melissa Tackney
M
Buyer's Agent in 2021
Melissa Tackney
Coldwell Banker Realty
(732) 671-1000
1 in this area
5 Total Sales
-
D
Seller's Agent in 2016
Daniel Wright
RE/MAX
-
Maria Sitoy
Buyer's Agent in 2016
Maria Sitoy
EXP Realty
(908) 510-0681
1 in this area
78 Total Sales
Map
Source: MOREMLS (Monmouth Ocean Regional REALTORS®)
MLS Number: 21629539
APN: 21-00078-02-00009
Disclaimer: Certain information contained herein is derived from information provided by parties other than Homes.com. All information provided is deemed reliable, but is not guaranteed to be accurate and should be independently verified.
![]() IDX information is provided exclusively for personal, non-commercial use, and may not be used for any purpose other than to identify prospective properties consumers may be interested in purchasing.
IDX information is provided exclusively for personal, non-commercial use, and may not be used for any purpose other than to identify prospective properties consumers may be interested in purchasing.
Information is deemed reliable but not guaranteed.
Nearby Homes