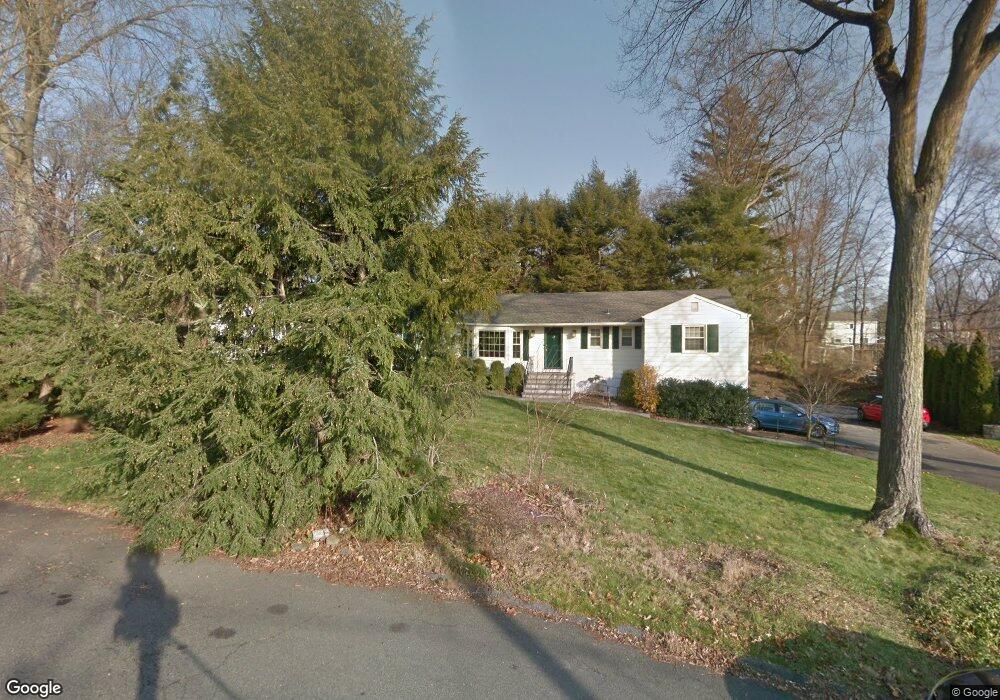
19 Robin Hood Ln Darien, CT 06820
Estimated Value: $1,845,000 - $2,489,000
5
Beds
4
Baths
2,816
Sq Ft
$768/Sq Ft
Est. Value
About This Home
This home is located at 19 Robin Hood Ln, Darien, CT 06820 and is currently estimated at $2,163,052, approximately $768 per square foot. 19 Robin Hood Ln is a home located in Fairfield County with nearby schools including Royle Elementary School, Middlesex Middle School, and Darien High School.
Ownership History
Date
Name
Owned For
Owner Type
Purchase Details
Closed on
Jul 26, 2000
Sold by
Austin Paul H and Austin Amy G
Bought by
Jonker Edward and Evola Maura J
Current Estimated Value
Purchase Details
Closed on
Aug 18, 1995
Sold by
Bowers Michael and James Katherine
Bought by
Austin Paul and Austin Amy
Purchase Details
Closed on
Aug 1, 1989
Sold by
Goll Catherine
Bought by
Bowers Michael
Create a Home Valuation Report for This Property
The Home Valuation Report is an in-depth analysis detailing your home's value as well as a comparison with similar homes in the area
Home Values in the Area
Average Home Value in this Area
Purchase History
| Date | Buyer | Sale Price | Title Company |
|---|---|---|---|
| Jonker Edward | $669,000 | -- | |
| Austin Paul | $412,000 | -- | |
| Bowers Michael | $340,000 | -- |
Source: Public Records
Mortgage History
| Date | Status | Borrower | Loan Amount |
|---|---|---|---|
| Open | Bowers Michael | $250,000 | |
| Closed | Bowers Michael | $417,000 |
Source: Public Records
Tax History Compared to Growth
Tax History
| Year | Tax Paid | Tax Assessment Tax Assessment Total Assessment is a certain percentage of the fair market value that is determined by local assessors to be the total taxable value of land and additions on the property. | Land | Improvement |
|---|---|---|---|---|
| 2025 | $15,640 | $1,010,310 | $710,010 | $300,300 |
| 2024 | $14,841 | $1,010,310 | $710,010 | $300,300 |
| 2023 | $13,330 | $756,980 | $507,150 | $249,830 |
| 2022 | $13,043 | $756,980 | $507,150 | $249,830 |
| 2021 | $12,748 | $756,980 | $507,150 | $249,830 |
| 2020 | $12,384 | $756,980 | $507,150 | $249,830 |
| 2019 | $12,467 | $756,980 | $507,150 | $249,830 |
| 2018 | $14,106 | $877,240 | $600,950 | $276,290 |
| 2017 | $14,176 | $877,240 | $600,950 | $276,290 |
| 2016 | $13,834 | $877,240 | $600,950 | $276,290 |
| 2015 | $13,015 | $847,910 | $600,950 | $246,960 |
| 2014 | $12,727 | $847,910 | $600,950 | $246,960 |
Source: Public Records
Map
Nearby Homes
- 93 Mansfield Ave
- 10 Prospect Ave
- 8 Sedgewick Village Ln
- 10 Stony Brook Rd
- 10 Pine Brook Ln
- 17 Pine Brook Ln Unit 17
- 51 Hale Ln Unit 51
- 20 Locust Hill Rd
- 6 Priscilla Ln
- 128 West Ave
- 130 West Ave
- 17 Brushy Hill Rd
- 5 Wakeman Rd
- 45 Hecker Ave
- 19 Littlebrook Rd
- 311 Noroton Ave
- 39 Noroton Ave
- 261 Hollow Tree Ridge Rd
- 97 Richards Ave Unit B10
- 97 Richards Ave Unit E12
- 22 Robin Hood Ln
- 15 Robin Hood Ln
- 69 Mansfield Ave
- 81 Mansfield Ave
- 73 Mansfield Ave
- 11 Robin Hood Ln
- 20 Robin Hood Ln
- 18 Robin Hood Ln
- 16 Robin Hood Ln
- 67 Mansfield Ave
- 12 Robin Hood Ln
- 6 Robin Hood Ln
- 10 Robin Hood Ln
- 77 Mansfield Ave
- 5 Robin Hood Ln
- 85 Mansfield Ave
- 8 Partridge Ln
- 10 Partridge Ln
- 51 Mansfield Ave
- 75 Mansfield Ave