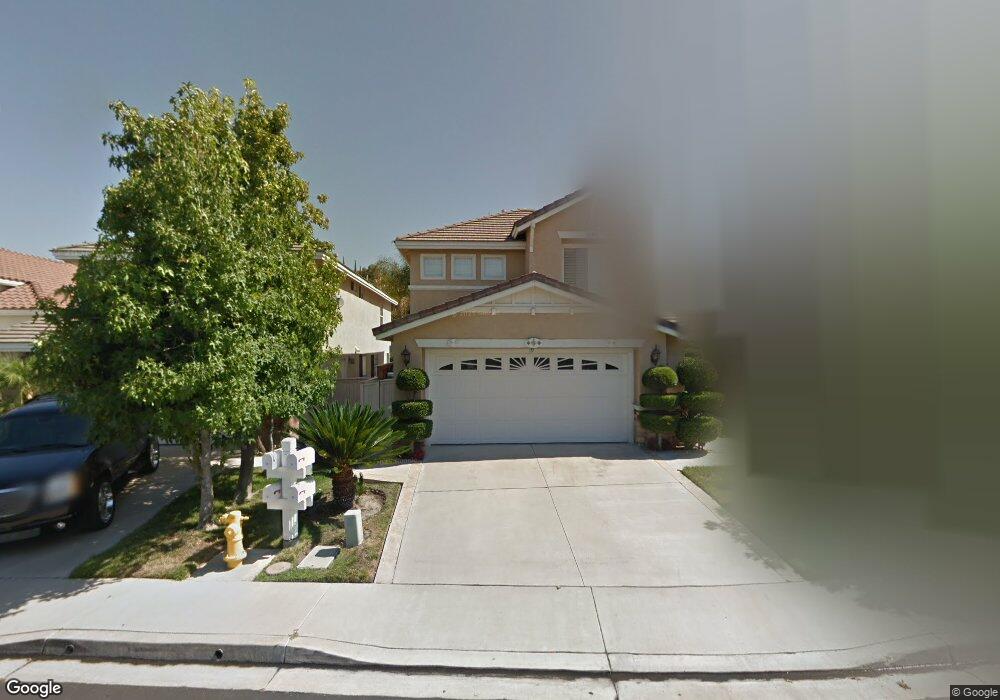
19 Sagecrest Foothill Ranch, CA 92610
Estimated Value: $1,149,238 - $1,256,000
4
Beds
3
Baths
1,899
Sq Ft
$637/Sq Ft
Est. Value
About This Home
This home is located at 19 Sagecrest, Foothill Ranch, CA 92610 and is currently estimated at $1,209,810, approximately $637 per square foot. 19 Sagecrest is a home located in Orange County with nearby schools including Foothill Ranch Elementary School, Rancho Santa Margarita Intermediate School, and Trabuco Hills High School.
Ownership History
Date
Name
Owned For
Owner Type
Purchase Details
Closed on
Feb 24, 2026
Sold by
Alonzo Romeo David and Grace Abigail
Bought by
Romeo David Alonzo And Grace Abigail Brion Al and Alonzo
Current Estimated Value
Purchase Details
Closed on
Nov 3, 1994
Sold by
Kaufman & Broad South Coast Inc
Bought by
Alonzo Romeo David and Alonzo Grace Abigail B
Home Financials for this Owner
Home Financials are based on the most recent Mortgage that was taken out on this home.
Original Mortgage
$197,780
Interest Rate
5.62%
Create a Home Valuation Report for This Property
The Home Valuation Report is an in-depth analysis detailing your home's value as well as a comparison with similar homes in the area
Home Values in the Area
Average Home Value in this Area
Purchase History
| Date | Buyer | Sale Price | Title Company |
|---|---|---|---|
| Romeo David Alonzo And Grace Abigail Brion Al | -- | None Listed On Document | |
| Alonzo Romeo David | $208,500 | First American Title Ins |
Source: Public Records
Mortgage History
| Date | Status | Borrower | Loan Amount |
|---|---|---|---|
| Previous Owner | Alonzo Romeo David | $197,780 |
Source: Public Records
Tax History
| Year | Tax Paid | Tax Assessment Tax Assessment Total Assessment is a certain percentage of the fair market value that is determined by local assessors to be the total taxable value of land and additions on the property. | Land | Improvement |
|---|---|---|---|---|
| 2025 | $3,568 | $349,686 | $81,693 | $267,993 |
| 2024 | $3,568 | $342,830 | $80,091 | $262,739 |
| 2023 | $3,484 | $336,108 | $78,520 | $257,588 |
| 2022 | $3,422 | $329,518 | $76,980 | $252,538 |
| 2021 | $2,587 | $323,057 | $75,470 | $247,587 |
| 2020 | $3,324 | $319,745 | $74,696 | $245,049 |
| 2019 | $3,258 | $313,476 | $73,231 | $240,245 |
| 2018 | $3,197 | $307,330 | $71,795 | $235,535 |
| 2017 | $3,133 | $301,304 | $70,387 | $230,917 |
| 2016 | $3,957 | $295,397 | $69,007 | $226,390 |
| 2015 | $3,973 | $290,960 | $67,970 | $222,990 |
| 2014 | $4,704 | $285,261 | $66,639 | $218,622 |
Source: Public Records
Map
Nearby Homes
Your Personal Tour Guide
Ask me questions while you tour the home.