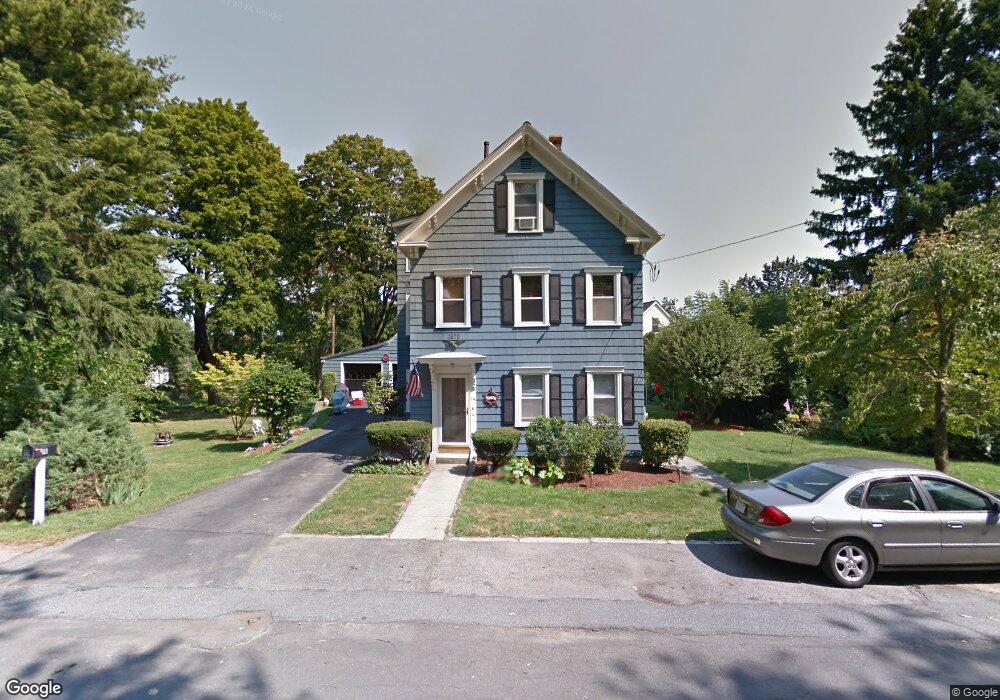
19 Summer St Methuen, MA 01844
Downtown Methuen NeighborhoodEstimated Value: $648,000 - $721,000
4
Beds
2
Baths
2,505
Sq Ft
$276/Sq Ft
Est. Value
About This Home
This home is located at 19 Summer St, Methuen, MA 01844 and is currently estimated at $691,704, approximately $276 per square foot. 19 Summer St is a home located in Essex County with nearby schools including Tenney Grammar School, Methuen High School, and Saint Monica School.
Ownership History
Date
Name
Owned For
Owner Type
Purchase Details
Closed on
May 9, 2025
Sold by
Diaz Adrian
Bought by
Adrian Diaz Lt and Diaz
Current Estimated Value
Purchase Details
Closed on
Aug 18, 2006
Sold by
Broadhurst Arthur and Broadhurst David D
Bought by
Diaz Adrian
Home Financials for this Owner
Home Financials are based on the most recent Mortgage that was taken out on this home.
Original Mortgage
$305,100
Interest Rate
6.88%
Mortgage Type
Purchase Money Mortgage
Purchase Details
Closed on
Oct 13, 2005
Sold by
Chapman Bernard Robert and Christensen Cynthia
Bought by
Broadhurst Arthur and Broadhurst David J
Home Financials for this Owner
Home Financials are based on the most recent Mortgage that was taken out on this home.
Original Mortgage
$408,500
Interest Rate
5.78%
Mortgage Type
Purchase Money Mortgage
Create a Home Valuation Report for This Property
The Home Valuation Report is an in-depth analysis detailing your home's value as well as a comparison with similar homes in the area
Home Values in the Area
Average Home Value in this Area
Purchase History
| Date | Buyer | Sale Price | Title Company |
|---|---|---|---|
| Adrian Diaz Lt | -- | None Available | |
| Adrian Diaz Lt | -- | None Available | |
| Diaz Adrian | $339,900 | -- | |
| Diaz Adrian | $339,900 | -- | |
| Broadhurst Arthur | $430,000 | -- | |
| Broadhurst Arthur | $430,000 | -- |
Source: Public Records
Mortgage History
| Date | Status | Borrower | Loan Amount |
|---|---|---|---|
| Previous Owner | Diaz Adrian | $305,100 | |
| Previous Owner | Broadhurst Arthur | $408,500 |
Source: Public Records
Tax History
| Year | Tax Paid | Tax Assessment Tax Assessment Total Assessment is a certain percentage of the fair market value that is determined by local assessors to be the total taxable value of land and additions on the property. | Land | Improvement |
|---|---|---|---|---|
| 2025 | $7,086 | $669,800 | $231,900 | $437,900 |
| 2024 | $6,481 | $596,800 | $211,500 | $385,300 |
| 2023 | $6,329 | $540,900 | $188,000 | $352,900 |
| 2022 | $5,788 | $443,500 | $156,700 | $286,800 |
| 2021 | $5,552 | $420,900 | $148,800 | $272,100 |
| 2020 | $5,360 | $398,800 | $148,800 | $250,000 |
| 2019 | $4,876 | $343,600 | $133,200 | $210,400 |
| 2018 | $4,659 | $326,500 | $133,200 | $193,300 |
| 2017 | $4,612 | $314,800 | $133,200 | $181,600 |
| 2016 | $4,262 | $287,800 | $125,300 | $162,500 |
| 2015 | $4,094 | $280,400 | $125,300 | $155,100 |
Source: Public Records
Map
Nearby Homes
- 123 Lawrence St
- 687 Jackson St
- 97 Kenwood Rd
- Lot 108 Garden City Rd
- 8 Ridgeview Ave
- 611 Prospect St
- 25 Carol Ave
- 82 Oakside Ave
- 9-11 Horne St
- 7 Brentwood Ave
- 593 Prospect St
- 7-9 Carleton Ct
- 173 Jackson St
- 64-66 Howe St
- 23 Bentley Cir
- 29 Center St
- 24 Railroad St
- 83 Arnold St
- 20-22 Ashland Ave
- 23 Chase St
Your Personal Tour Guide
Ask me questions while you tour the home.