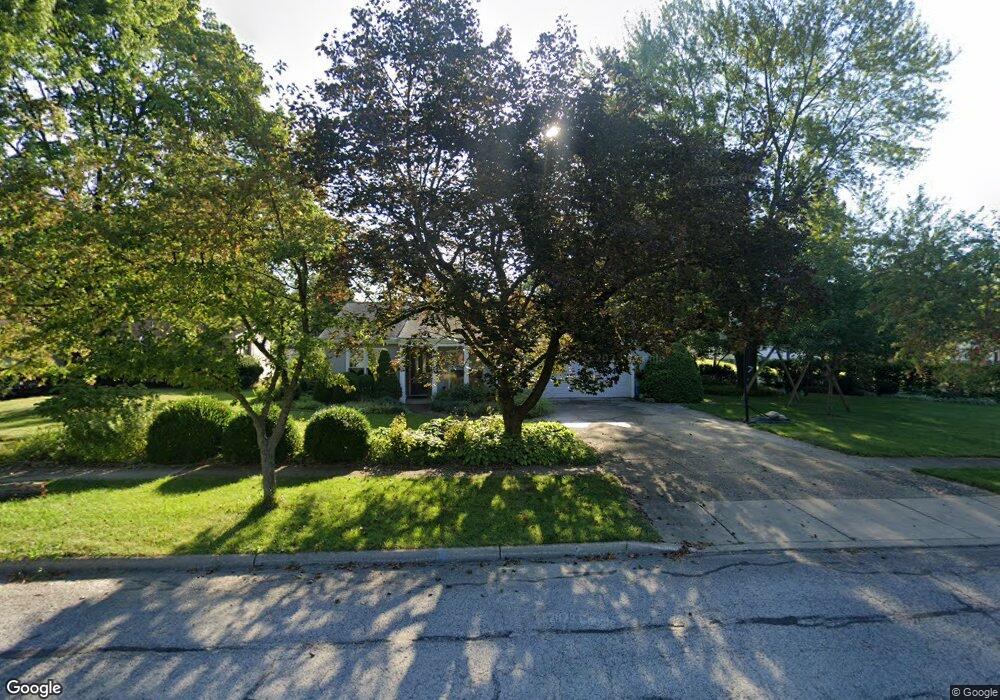
19 Thomas St Oberlin, OH 44074
Estimated Value: $254,161 - $292,000
3
Beds
2
Baths
1,918
Sq Ft
$140/Sq Ft
Est. Value
About This Home
This home is located at 19 Thomas St, Oberlin, OH 44074 and is currently estimated at $269,040, approximately $140 per square foot. 19 Thomas St is a home located in Lorain County with nearby schools including Oberlin Elementary School, Prospect Elementary School, and Langston Middle School.
Ownership History
Date
Name
Owned For
Owner Type
Purchase Details
Closed on
May 10, 2001
Sold by
Brettnacher Daniel L and Brettnacher Allison R
Bought by
Petzak Nicholas P and Bryan Jennifer E
Current Estimated Value
Home Financials for this Owner
Home Financials are based on the most recent Mortgage that was taken out on this home.
Original Mortgage
$124,400
Outstanding Balance
$47,138
Interest Rate
7.23%
Estimated Equity
$221,902
Purchase Details
Closed on
Jun 25, 1998
Sold by
Isom Mark A
Bought by
Brettnacher Daniel L and Brettnacher Allison R
Home Financials for this Owner
Home Financials are based on the most recent Mortgage that was taken out on this home.
Original Mortgage
$114,200
Interest Rate
7.37%
Mortgage Type
VA
Purchase Details
Closed on
Mar 15, 1995
Sold by
Allen Lester
Bought by
Isom Mark A
Home Financials for this Owner
Home Financials are based on the most recent Mortgage that was taken out on this home.
Original Mortgage
$58,000
Interest Rate
8.97%
Mortgage Type
New Conventional
Create a Home Valuation Report for This Property
The Home Valuation Report is an in-depth analysis detailing your home's value as well as a comparison with similar homes in the area
Home Values in the Area
Average Home Value in this Area
Purchase History
| Date | Buyer | Sale Price | Title Company |
|---|---|---|---|
| Petzak Nicholas P | $131,000 | Real Estate Title Service Co | |
| Brettnacher Daniel L | $112,000 | Midland Title | |
| Isom Mark A | $77,500 | -- |
Source: Public Records
Mortgage History
| Date | Status | Borrower | Loan Amount |
|---|---|---|---|
| Open | Petzak Nicholas P | $124,400 | |
| Previous Owner | Brettnacher Daniel L | $114,200 | |
| Previous Owner | Isom Mark A | $58,000 |
Source: Public Records
Tax History Compared to Growth
Tax History
| Year | Tax Paid | Tax Assessment Tax Assessment Total Assessment is a certain percentage of the fair market value that is determined by local assessors to be the total taxable value of land and additions on the property. | Land | Improvement |
|---|---|---|---|---|
| 2024 | $3,673 | $74,417 | $16,632 | $57,785 |
| 2023 | $2,952 | $53,564 | $7,798 | $45,766 |
| 2022 | $2,873 | $53,564 | $7,798 | $45,766 |
| 2021 | $2,867 | $53,564 | $7,798 | $45,766 |
| 2020 | $2,588 | $45,440 | $6,620 | $38,820 |
| 2019 | $2,555 | $45,440 | $6,620 | $38,820 |
| 2018 | $2,571 | $45,440 | $6,620 | $38,820 |
| 2017 | $2,570 | $46,830 | $8,640 | $38,190 |
| 2016 | $2,596 | $46,830 | $8,640 | $38,190 |
| 2015 | $2,599 | $46,830 | $8,640 | $38,190 |
| 2014 | $2,512 | $44,170 | $8,150 | $36,020 |
| 2013 | $2,469 | $44,170 | $8,150 | $36,020 |
Source: Public Records
Map
Nearby Homes
- 649 Kimberly Cir
- 679 Kimberly Cir
- 95 Shipherd Cir
- 110 Shipherd Cir
- 63 Spring St
- 12380 Oberlin Rd
- 29 S Pleasant St
- 111 N Pleasant St
- 83 S Pleasant St
- 62 Locust St
- 216 N Main St
- 182 E Hamilton St
- 230 N Main St
- 359 S Pleasant St
- 44 W Vine St
- 89 S Professor St
- 81 S Professor St
- 121 S Professor St
- 123 S Professor St
- 345 N Professor St
- 31 Thomas St
- 625 E College St
- 640 E College St
- 22 Thomas St
- 16 Thomas St
- 639 E College St
- 30 Thomas St
- 615 E College St
- 45 Thomas St
- 596 E College St
- 645 E College St
- 36 Thomas St
- 648 E College St
- 51 Thomas St
- 597 E College St
- 50 Thomas St
- 650 Kimberly Cir
- 629 E Lorain St
- 664 E College St
- 648 Kimberly Cir