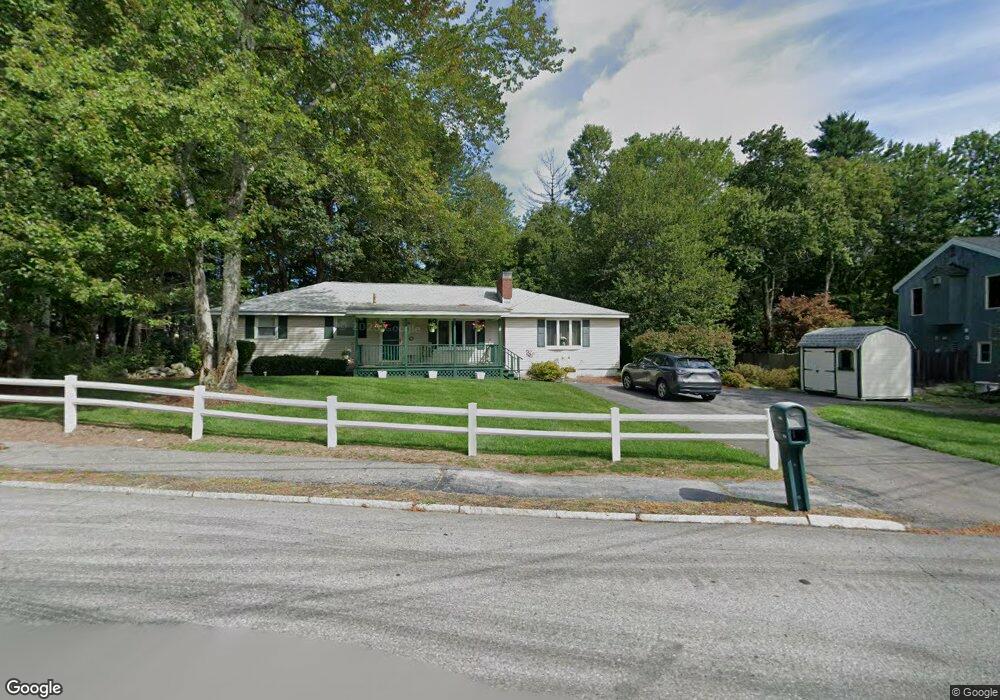
19 Whitford Rd Nashua, NH 03062
West Hollis NeighborhoodEstimated Value: $520,448 - $577,000
3
Beds
2
Baths
1,402
Sq Ft
$387/Sq Ft
Est. Value
About This Home
This home is located at 19 Whitford Rd, Nashua, NH 03062 and is currently estimated at $542,362, approximately $386 per square foot. 19 Whitford Rd is a home located in Hillsborough County with nearby schools including Main Dunstable School, Elm Street Middle School, and Nashua High School South.
Ownership History
Date
Name
Owned For
Owner Type
Purchase Details
Closed on
Sep 25, 1998
Sold by
Carignan Streven V and Carignan Mary Anne
Bought by
Cogliano Theresa M
Current Estimated Value
Home Financials for this Owner
Home Financials are based on the most recent Mortgage that was taken out on this home.
Original Mortgage
$119,019
Interest Rate
6.87%
Mortgage Type
Purchase Money Mortgage
Create a Home Valuation Report for This Property
The Home Valuation Report is an in-depth analysis detailing your home's value as well as a comparison with similar homes in the area
Home Values in the Area
Average Home Value in this Area
Purchase History
| Date | Buyer | Sale Price | Title Company |
|---|---|---|---|
| Cogliano Theresa M | $141,900 | -- |
Source: Public Records
Mortgage History
| Date | Status | Borrower | Loan Amount |
|---|---|---|---|
| Open | Cogliano Theresa M | $121,900 | |
| Closed | Cogliano Theresa M | $100,000 | |
| Closed | Cogliano Theresa M | $119,019 |
Source: Public Records
Tax History Compared to Growth
Tax History
| Year | Tax Paid | Tax Assessment Tax Assessment Total Assessment is a certain percentage of the fair market value that is determined by local assessors to be the total taxable value of land and additions on the property. | Land | Improvement |
|---|---|---|---|---|
| 2024 | $7,362 | $463,000 | $173,500 | $289,500 |
| 2023 | $7,039 | $386,100 | $138,800 | $247,300 |
| 2022 | $6,977 | $386,100 | $138,800 | $247,300 |
| 2021 | $6,337 | $272,900 | $97,100 | $175,800 |
| 2020 | $6,170 | $272,900 | $97,100 | $175,800 |
| 2019 | $5,938 | $272,900 | $97,100 | $175,800 |
| 2018 | $5,788 | $272,900 | $97,100 | $175,800 |
| 2017 | $5,511 | $213,700 | $74,100 | $139,600 |
| 2016 | $5,357 | $213,700 | $74,100 | $139,600 |
| 2015 | $5,242 | $213,700 | $74,100 | $139,600 |
| 2014 | $5,139 | $213,700 | $74,100 | $139,600 |
Source: Public Records
Map
Nearby Homes
- 2 Rene Dr
- 58 Tanglewood Dr
- 25 Cortez Dr Unit U57
- 5 Wilderness Dr
- 12 Clovercrest Dr
- 22 Newburgh Rd
- 15 Westray Dr
- 4 Chesapeake Rd
- 1014 W Hollis St
- 16 Laurel Ct Unit U320
- 31 Tenby Dr
- 188 Harris Rd
- 12 Spring Cove Rd Unit U103
- 5 Plainfield Ln
- 40 Spring Cove Rd Unit U117
- 47 Dogwood Dr Unit U202
- 20 Martha St
- 91 Century Way
- 61 Wilderness Dr
- 59 Wilderness Dr