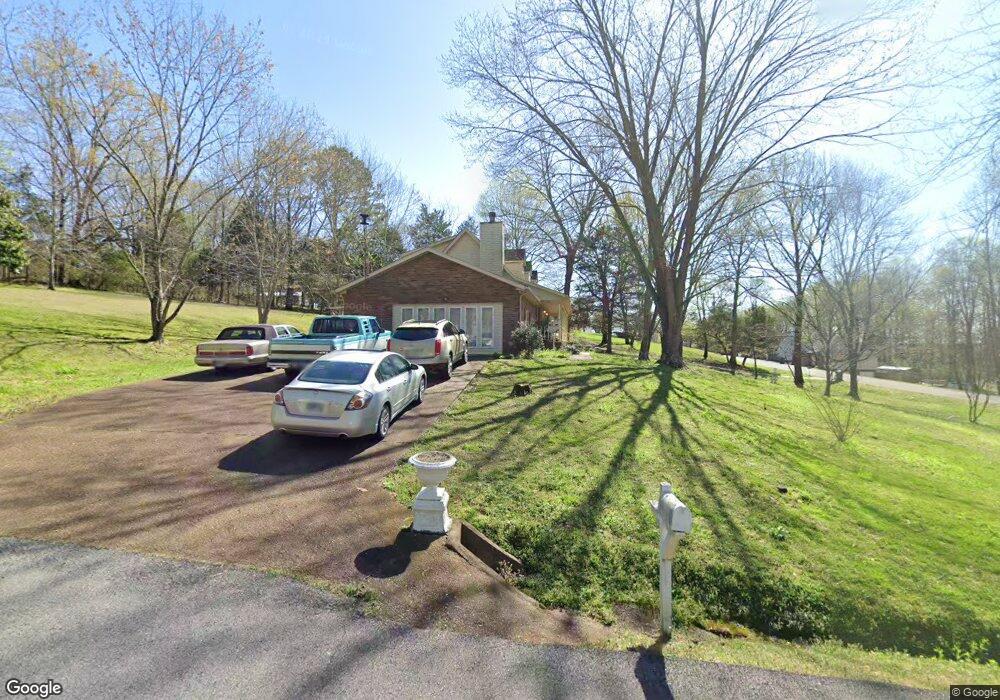
190 Hickory Hollow Dr Dickson, TN 37055
Estimated Value: $443,000 - $573,000
--
Bed
3
Baths
2,634
Sq Ft
$189/Sq Ft
Est. Value
About This Home
This home is located at 190 Hickory Hollow Dr, Dickson, TN 37055 and is currently estimated at $497,841, approximately $189 per square foot. 190 Hickory Hollow Dr is a home located in Dickson County with nearby schools including Centennial Elementary School, Dickson Middle School, and Dickson County High School.
Ownership History
Date
Name
Owned For
Owner Type
Purchase Details
Closed on
Jan 2, 2020
Sold by
Fossie Marvin
Bought by
Fossie Reginald M
Current Estimated Value
Purchase Details
Closed on
Jun 22, 1990
Bought by
Fossie Marvin and Addie Marie
Purchase Details
Closed on
Jun 29, 1989
Bought by
Burgess Reba and Billy Teal
Create a Home Valuation Report for This Property
The Home Valuation Report is an in-depth analysis detailing your home's value as well as a comparison with similar homes in the area
Home Values in the Area
Average Home Value in this Area
Purchase History
| Date | Buyer | Sale Price | Title Company |
|---|---|---|---|
| Fossie Reginald M | -- | -- | |
| Fossie Marvin | $16,500 | -- | |
| Burgess Reba | -- | -- |
Source: Public Records
Tax History Compared to Growth
Tax History
| Year | Tax Paid | Tax Assessment Tax Assessment Total Assessment is a certain percentage of the fair market value that is determined by local assessors to be the total taxable value of land and additions on the property. | Land | Improvement |
|---|---|---|---|---|
| 2025 | -- | $99,650 | $0 | $0 |
| 2024 | $2,225 | $99,775 | $13,075 | $86,700 |
| 2023 | $2,225 | $71,250 | $8,425 | $62,825 |
| 2022 | $2,225 | $71,250 | $8,425 | $62,825 |
| 2021 | $2,225 | $71,250 | $8,425 | $62,825 |
| 2020 | $2,225 | $71,250 | $8,425 | $62,825 |
| 2019 | $2,225 | $71,250 | $8,425 | $62,825 |
| 2018 | $2,340 | $64,125 | $7,500 | $56,625 |
| 2017 | $2,340 | $64,125 | $7,500 | $56,625 |
| 2016 | $2,340 | $64,125 | $7,500 | $56,625 |
| 2015 | $2,126 | $54,800 | $7,500 | $47,300 |
| 2014 | $2,126 | $54,800 | $7,500 | $47,300 |
Source: Public Records
Map
Nearby Homes
- 228 Druid Hills Dr
- 2 Old Pond Ln
- 4 Old Pond Ln
- 3 Old Pond Ln
- 5 Dogwood Ct
- 1233 N Charlotte St
- 435 Old Pond Ln
- 1236 N Charlotte St
- 444 Old Pond Ln
- 445 Old Pond Ln
- 2 Hickory Hill Dr
- 471 Old Pond Ln
- 201 Tanglewood Dr
- 1105 N Charlotte St
- 404 Masters Way
- 0 Old Pond Ln
- 1012 Northside Dr
- 500 Country Club Dr
- 1155 Westfield Rd
- 109 Brook Dr
- 186 Hickory Hollow Dr
- 182 Hickory Hollow Dr
- 201 Teal Dr
- 203 Teal Dr
- 204 Teal Dr
- 214 Druid Hills Dr
- 176 Hickory Hollow Dr
- 212 Druid Hills Dr
- 183 Hickory Hollow Dr
- 205 Teal Dr
- 119 Edgewood Place
- 177 Hickory Hollow Dr
- 172 Hickory Hollow Dr
- 112 Edgewood Place
- 173 Hickory Hollow Dr
- 210 Druid Hills Dr
- 205 Plantation Ct
- 167 Hickory Hollow Dr
- 117 Edgewood Place
- 203 Plantation Ct