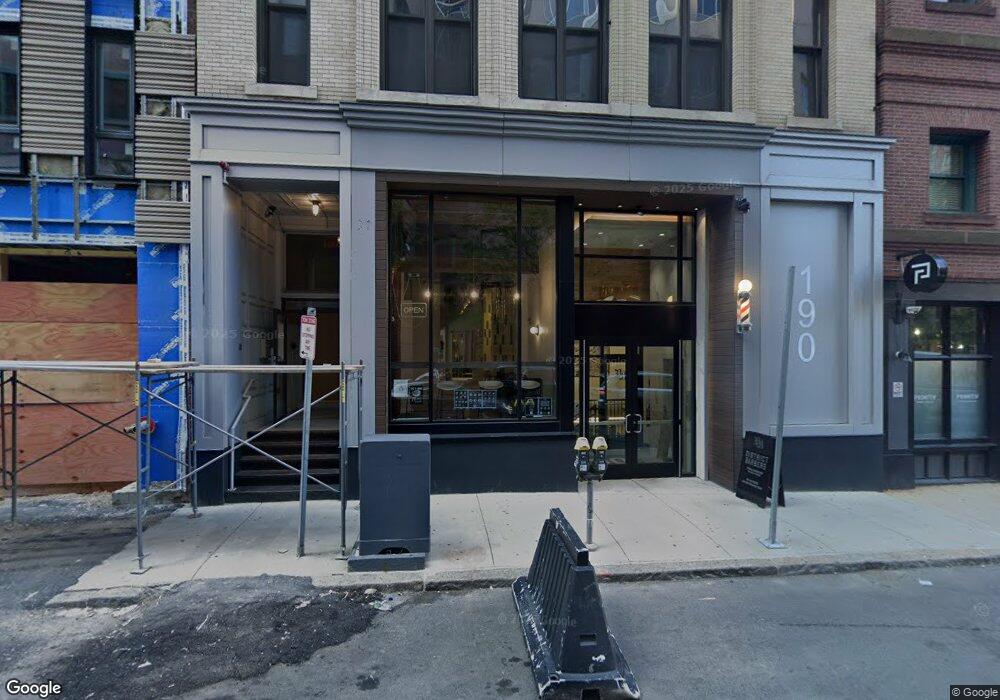
190 High St Boston, MA 02110
Downtown Boston NeighborhoodEstimated Value: $10,496,526
--
Bed
--
Bath
12,744
Sq Ft
$824/Sq Ft
Est. Value
About This Home
This home is located at 190 High St, Boston, MA 02110 and is currently estimated at $10,496,526, approximately $823 per square foot. 190 High St is a home located in Suffolk County with nearby schools including St John School, Torit Montessori School, and Advent School.
Ownership History
Date
Name
Owned For
Owner Type
Purchase Details
Closed on
Oct 11, 2017
Sold by
Newbliss Rt
Bought by
Ldj Development Llc
Current Estimated Value
Home Financials for this Owner
Home Financials are based on the most recent Mortgage that was taken out on this home.
Original Mortgage
$4,650,000
Outstanding Balance
$3,884,059
Interest Rate
3.82%
Mortgage Type
Unknown
Estimated Equity
$6,612,467
Create a Home Valuation Report for This Property
The Home Valuation Report is an in-depth analysis detailing your home's value as well as a comparison with similar homes in the area
Home Values in the Area
Average Home Value in this Area
Purchase History
| Date | Buyer | Sale Price | Title Company |
|---|---|---|---|
| Ldj Development Llc | $6,200,000 | -- |
Source: Public Records
Mortgage History
| Date | Status | Borrower | Loan Amount |
|---|---|---|---|
| Open | Ldj Development Llc | $4,650,000 |
Source: Public Records
Tax History Compared to Growth
Tax History
| Year | Tax Paid | Tax Assessment Tax Assessment Total Assessment is a certain percentage of the fair market value that is determined by local assessors to be the total taxable value of land and additions on the property. | Land | Improvement |
|---|---|---|---|---|
| 2025 | $59,017 | $2,273,400 | $1,029,300 | $1,244,100 |
| 2024 | $68,178 | $2,698,000 | $1,029,300 | $1,668,700 |
| 2023 | $69,193 | $2,803,600 | $1,029,300 | $1,774,300 |
| 2022 | $67,216 | $2,690,800 | $1,029,300 | $1,661,500 |
| 2021 | $58,888 | $2,398,700 | $815,300 | $1,583,400 |
| 2020 | $57,882 | $2,322,700 | $815,300 | $1,507,400 |
| 2019 | $63,675 | $2,547,000 | $815,200 | $1,731,800 |
| 2018 | $61,110 | $2,425,000 | $799,800 | $1,625,200 |
| 2017 | $58,516 | $2,306,500 | $761,200 | $1,545,300 |
| 2016 | $51,824 | $1,933,000 | $705,100 | $1,227,900 |
| 2015 | $49,948 | $1,692,000 | $629,800 | $1,062,200 |
| 2014 | $51,073 | $1,638,000 | $540,900 | $1,097,100 |
Source: Public Records
Map
Nearby Homes
- 99-105 Broad St Unit 4F
- 101 Broad St Unit 8B
- 101 Broad St Unit 8C
- 110 Broad St Unit 602
- 80 Broad Street Parking Space 57
- 80 Broad St Unit 603
- 80 Broad St Unit 302
- 80 Broad St Unit 1204
- 80 Broad St Unit 306
- 80 Broad St Unit 303
- 80 Broad St Unit 1002
- 80 Broad St Unit 805
- 65 E India Row Unit PHC
- 65 E India Row Unit Penthouse B
- 65 E India Row Unit 10G
- 65 E India Row Unit 22C
- 65 E India Row Unit PHF
- 65 E India Row Unit 9C
- 65 E India Row Unit 9B
- 10 Rowes Wharf Unit 1003
- 190 High St Unit 601
- 190 High St Unit 5
- 190 High St Unit Street
- 188 High St
- 87 Wendell St Unit 4
- 85 Wendell St
- 131 Broad St Unit 902H
- 109 Broad St
- 125 Broad St Unit 4
- 125 Broad St Unit 5
- 125 Broad St Unit 6
- 125 Broad St
- 7 Wendell St Unit 4
- 7 Wendell St Unit 1
- 7 Wendell St Unit 3
- 7 Wendell St Unit 2
- 7 Wendell St
- 7 Wendell St
- 1 Wendell St Unit Penthouse
- 1 Wendell St