190 Johnson St Savannah, TN 38372
Estimated Value: $23,890 - $71,000
--
Bed
1
Bath
622
Sq Ft
$92/Sq Ft
Est. Value
About This Home
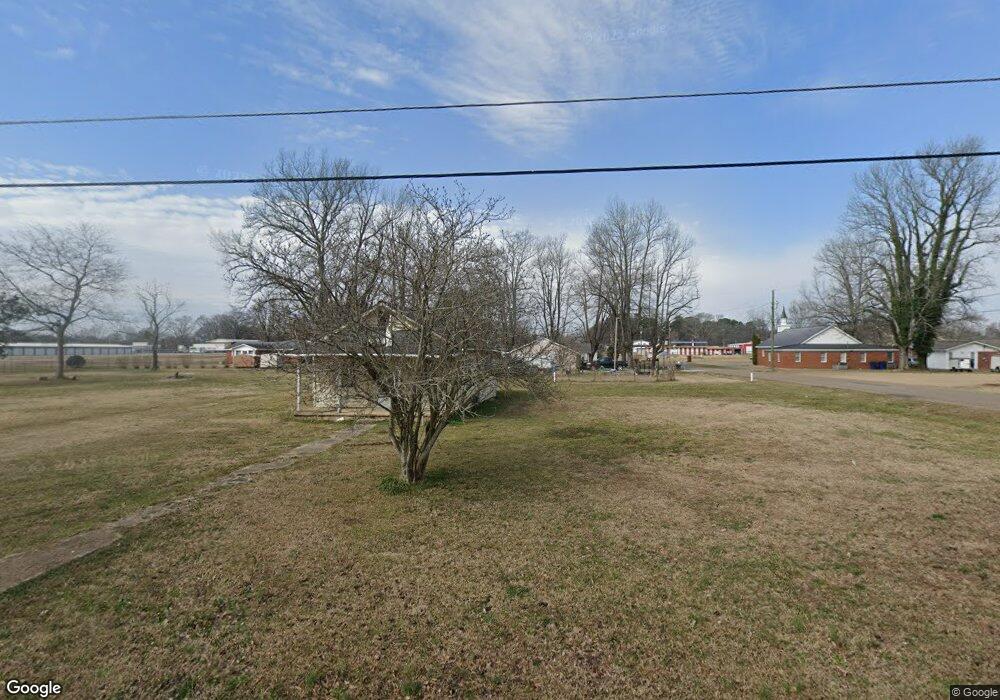
This home is located at 190 Johnson St, Savannah, TN 38372 and is currently estimated at $57,473, approximately $92 per square foot. 190 Johnson St is a home located in Hardin County with nearby schools including Hardin County High School and Hardin County Christian School.
Ownership History
Date
Name
Owned For
Owner Type
Purchase Details
Closed on
Jun 9, 2020
Sold by
Black Linda Paulette
Bought by
Stamp Letisha Rene
Current Estimated Value
Purchase Details
Closed on
Dec 29, 2017
Sold by
Roberts Robert A
Bought by
Black Linda Paulette
Purchase Details
Closed on
Feb 24, 2015
Sold by
Central Bank
Bought by
Roberts Garcie
Purchase Details
Closed on
Jan 23, 2015
Sold by
Lopez Maria
Bought by
Central Bank
Purchase Details
Closed on
Oct 23, 2012
Sold by
Lopez Maria J
Bought by
Lopez Maria and Lopez Edwin
Purchase Details
Closed on
Mar 23, 2007
Bought by
Lopex Maria
Purchase Details
Closed on
Mar 12, 2004
Bought by
Rodriguez Maria Baker and Rodriguez Carlos Javier
Purchase Details
Closed on
Apr 18, 2001
Sold by
Reed John Henry
Bought by
Mcfalls Charles M and Mcfalls Margar
Purchase Details
Closed on
Feb 9, 1999
Sold by
Baker Maysel
Bought by
Reed John
Purchase Details
Closed on
Mar 28, 1989
Bought by
Reed Price
Purchase Details
Closed on
Oct 14, 1988
Bought by
Reed Price
Purchase Details
Closed on
May 19, 1962
Bought by
Reed Price
Create a Home Valuation Report for This Property
The Home Valuation Report is an in-depth analysis detailing your home's value as well as a comparison with similar homes in the area
Home Values in the Area
Average Home Value in this Area
Purchase History
| Date | Buyer | Sale Price | Title Company |
|---|---|---|---|
| Stamp Letisha Rene | -- | None Available | |
| Black Linda Paulette | -- | -- | |
| Roberts Garcie | $11,250 | -- | |
| Central Bank | $11,029 | -- | |
| Lopez Maria | -- | -- | |
| Lopex Maria | $25,000 | -- | |
| Rodriguez Maria Baker | $18,000 | -- | |
| Mcfalls Charles M | $9,100 | -- | |
| Reed John | $8,000 | -- | |
| Reed Price | -- | -- | |
| Reed Price | -- | -- | |
| Reed Price | -- | -- |
Source: Public Records
Tax History Compared to Growth
Tax History
| Year | Tax Paid | Tax Assessment Tax Assessment Total Assessment is a certain percentage of the fair market value that is determined by local assessors to be the total taxable value of land and additions on the property. | Land | Improvement |
|---|---|---|---|---|
| 2024 | $141 | $5,750 | $2,125 | $3,625 |
| 2023 | $141 | $5,750 | $2,125 | $3,625 |
| 2022 | $113 | $4,100 | $2,125 | $1,975 |
| 2021 | $113 | $4,100 | $2,125 | $1,975 |
| 2020 | $113 | $4,100 | $2,125 | $1,975 |
| 2019 | $113 | $4,100 | $2,125 | $1,975 |
| 2018 | $111 | $4,100 | $2,125 | $1,975 |
| 2017 | $96 | $3,475 | $1,725 | $1,750 |
| 2016 | $96 | $3,475 | $1,725 | $1,750 |
| 2015 | $88 | $3,475 | $1,725 | $1,750 |
| 2014 | $88 | $3,475 | $1,725 | $1,750 |
Source: Public Records
Map
Nearby Homes
- 250 Ranch St
- 530 Stout St
- 220 Chinkapin Cove
- 7085 Cravens Rd
- 150 Eureka St
- 134 Vine St
- 160 Gean Ln
- 110 Eureka St
- 0 Pickwick St Unit 2501597
- 51 Blythe St
- 250 Parkview Dr
- 295 Claybrook Dr
- 280 Meadowlane Dr
- 355 Vine St
- 70 Red Fern Cove
- 229 Stadium Dr
- 0 High Pointe Dr Unit 10202679
- 6 High Pointe Dr
- 7 High Pointe Dr
- 190 Turner Kyle Dr