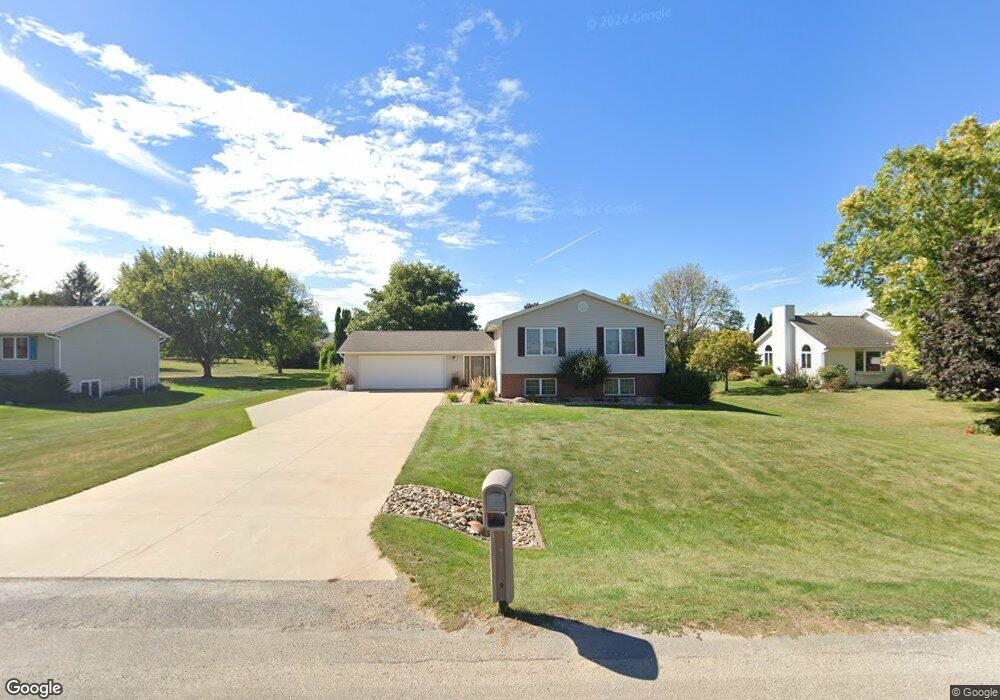
1901 2nd Ave Vinton, IA 52349
Estimated Value: $225,000 - $314,000
3
Beds
3
Baths
1,440
Sq Ft
$193/Sq Ft
Est. Value
About This Home
This home is located at 1901 2nd Ave, Vinton, IA 52349 and is currently estimated at $277,705, approximately $192 per square foot. 1901 2nd Ave is a home located in Benton County with nearby schools including Tilford Elementary School, Shellsburg Elementary School, and Vinton-Shellsburg Middle School.
Ownership History
Date
Name
Owned For
Owner Type
Purchase Details
Closed on
Mar 17, 2021
Sold by
Boddicker Christopher L and Boddicker Kourtney N
Bought by
Boddicker Christopher L and Boddicker Kourtney N
Current Estimated Value
Purchase Details
Closed on
Sep 18, 2015
Sold by
Libbert Brett and Libbert Brittany
Bought by
Boddicker Christopher L and Boddicker Kourtney N
Home Financials for this Owner
Home Financials are based on the most recent Mortgage that was taken out on this home.
Original Mortgage
$193,877
Outstanding Balance
$152,226
Interest Rate
3.9%
Mortgage Type
New Conventional
Estimated Equity
$125,479
Create a Home Valuation Report for This Property
The Home Valuation Report is an in-depth analysis detailing your home's value as well as a comparison with similar homes in the area
Home Values in the Area
Average Home Value in this Area
Purchase History
| Date | Buyer | Sale Price | Title Company |
|---|---|---|---|
| Boddicker Christopher L | -- | None Available | |
| Boddicker Christopher L | $197,000 | None Available |
Source: Public Records
Mortgage History
| Date | Status | Borrower | Loan Amount |
|---|---|---|---|
| Open | Boddicker Christopher L | $193,877 |
Source: Public Records
Tax History Compared to Growth
Tax History
| Year | Tax Paid | Tax Assessment Tax Assessment Total Assessment is a certain percentage of the fair market value that is determined by local assessors to be the total taxable value of land and additions on the property. | Land | Improvement |
|---|---|---|---|---|
| 2025 | $4,328 | $262,700 | $37,400 | $225,300 |
| 2024 | $4,328 | $241,200 | $37,400 | $203,800 |
| 2023 | $4,108 | $241,200 | $37,400 | $203,800 |
| 2022 | $4,216 | $199,800 | $29,900 | $169,900 |
| 2021 | $4,216 | $199,800 | $29,900 | $169,900 |
| 2020 | $3,854 | $186,900 | $24,200 | $162,700 |
| 2019 | $3,854 | $186,900 | $24,200 | $162,700 |
| 2018 | $3,738 | $184,300 | $23,300 | $161,000 |
| 2017 | $3,592 | $184,300 | $23,300 | $161,000 |
| 2016 | $3,490 | $172,300 | $21,800 | $150,500 |
| 2015 | $3,490 | $170,400 | $21,800 | $148,600 |
| 2014 | $3,708 | $171,500 | $0 | $0 |
Source: Public Records
Map
Nearby Homes