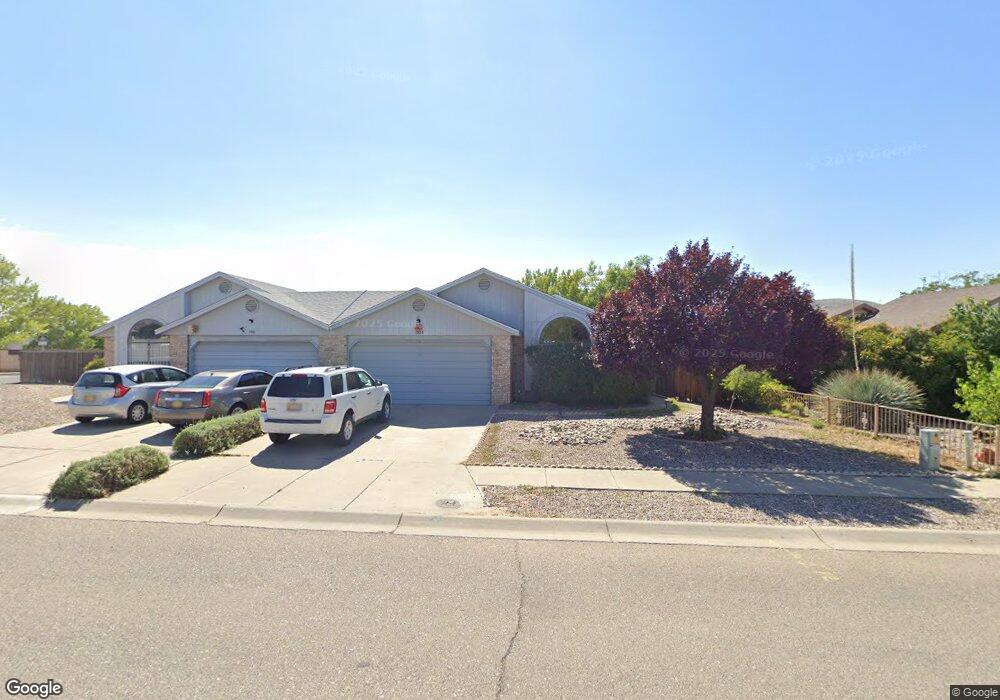
1901 Gomez Dr SW Los Lunas, NM 87031
Estimated Value: $232,000 - $258,087
3
Beds
2
Baths
1,210
Sq Ft
$203/Sq Ft
Est. Value
About This Home
This home is located at 1901 Gomez Dr SW, Los Lunas, NM 87031 and is currently estimated at $245,522, approximately $202 per square foot. 1901 Gomez Dr SW is a home located in Valencia County with nearby schools including Katherine Gallegos Elementary School, Los Lunas Middle School, and Los Lunas High School.
Ownership History
Date
Name
Owned For
Owner Type
Purchase Details
Closed on
Apr 23, 2013
Sold by
Chapman James N and Chapman Patricia S
Bought by
Chapman James N and Chapman Patricia S
Current Estimated Value
Purchase Details
Closed on
Mar 24, 2009
Sold by
Chapman Properties Gomez Llc
Bought by
Chapman James N and Chapman Patricia S
Purchase Details
Closed on
Aug 25, 2008
Sold by
Chapman James N and Chapman Patricia S
Bought by
Chapman Properties Gomez Llc
Purchase Details
Closed on
Jul 27, 2007
Sold by
Bankert Mary Katherine
Bought by
Chapman James N and Chapman Patricia S
Home Financials for this Owner
Home Financials are based on the most recent Mortgage that was taken out on this home.
Original Mortgage
$112,500
Interest Rate
6.71%
Mortgage Type
New Conventional
Purchase Details
Closed on
Dec 3, 2004
Sold by
Bankert William B and Bankert Mary K
Bought by
Bankert William Byron and Bankert Mary Katherine
Create a Home Valuation Report for This Property
The Home Valuation Report is an in-depth analysis detailing your home's value as well as a comparison with similar homes in the area
Home Values in the Area
Average Home Value in this Area
Purchase History
| Date | Buyer | Sale Price | Title Company |
|---|---|---|---|
| Chapman James N | -- | Old Republic Title Ins | |
| Chapman James N | -- | -- | |
| Chapman Properties Gomez Llc | -- | None Available | |
| Chapman James N | -- | Grande Title Co Inc | |
| Bankert William Byron | -- | First American Title Ins Co |
Source: Public Records
Mortgage History
| Date | Status | Borrower | Loan Amount |
|---|---|---|---|
| Previous Owner | Chapman James N | $112,500 |
Source: Public Records
Tax History Compared to Growth
Tax History
| Year | Tax Paid | Tax Assessment Tax Assessment Total Assessment is a certain percentage of the fair market value that is determined by local assessors to be the total taxable value of land and additions on the property. | Land | Improvement |
|---|---|---|---|---|
| 2024 | $1,201 | $36,260 | $8,040 | $28,220 |
| 2023 | $1,158 | $35,204 | $7,951 | $27,253 |
| 2022 | $1,139 | $34,179 | $7,917 | $26,262 |
| 2021 | $1,116 | $33,184 | $7,885 | $25,299 |
| 2020 | $1,105 | $32,217 | $7,655 | $24,562 |
| 2019 | $1,111 | $32,217 | $7,655 | $24,562 |
| 2018 | $1,059 | $31,278 | $7,445 | $23,833 |
| 2017 | $1,013 | $30,367 | $7,242 | $23,125 |
| 2016 | $985 | $29,483 | $7,045 | $22,438 |
| 2015 | -- | $28,625 | $6,853 | $21,772 |
| 2013 | -- | $32,616 | $8,583 | $24,033 |
| 2011 | -- | $121,869 | $28,113 | $93,756 |
Source: Public Records
Map
Nearby Homes
- 1628 Drake Rd
- 0 Drake Rd
- 1107 Valley View Dr SW
- 1034 Wagon Trail St
- 1050 Wagon Trail St SW
- 1330 Crestview Dr SW
- 2258 Calle de Ortiz SW
- 1864 Villa Contesa Loop NW
- 2260 Calle de Alifas SW
- 1407 Valley View Dr SW
- 981 Canal Blvd SW
- 2248 Calle de Silverio
- 823 Corral St SW
- 1902 Valley View Dr SW
- 1551 Valley View Dr SW
- 2260 Firewheel Ave SW
- 960 Firewheel Loop SW
- 2512 Red Sky SW
- 1551 Corta Cancun
- 711 Firewheel Loop SW
- 1001 Parkview Dr
- 922 Entrada Dr SW
- 1907 Gomez Dr SW
- 1902 Panoan Dr SW
- 918 Entrada Dr SW
- 1908 Panoan Dr SW
- 1913 Gomez Dr SW
- 1005 Parkview Dr
- 1000 Parkview Dr
- 1000 Parkview L Dr
- 1912 Panoan Dr SW
- 914 Entrada Dr SW
- 1900 Gomez Dr SW
- 1919 Gomez Dr SW
- 1006 Parkview Dr
- 910 Entrada Dr SW
- 1015 Parkview Dr
- 1918 Panoan Dr SW
- 1818 Ash Dr SW
- 1906 Gomez Dr SW