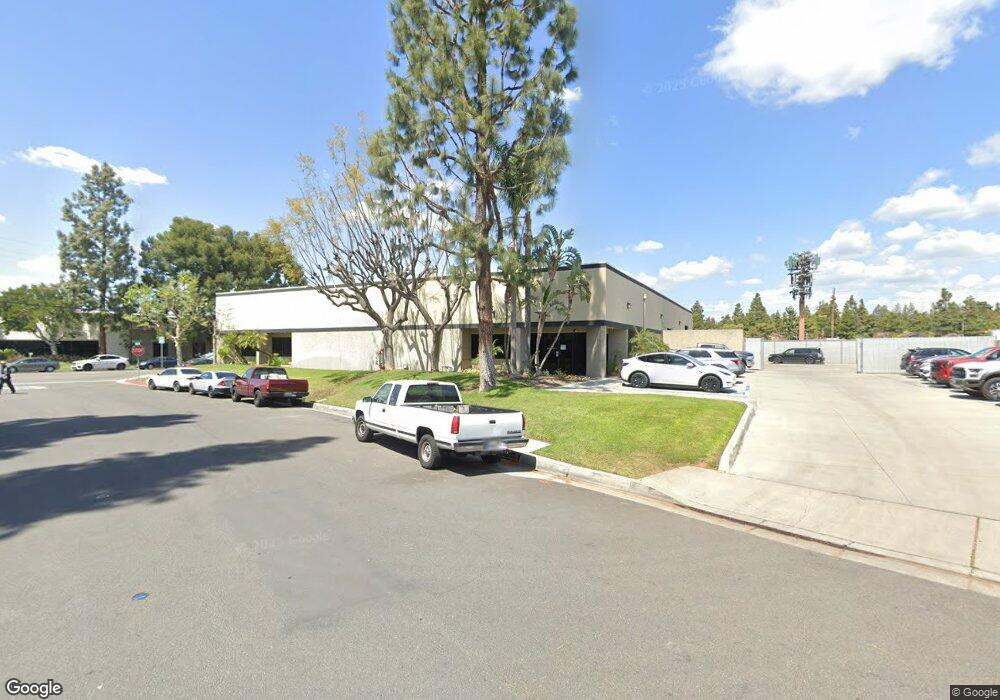
1901 Nancita Cir Placentia, CA 92870
Estimated Value: $4,368,643
--
Bed
--
Bath
14,124
Sq Ft
$309/Sq Ft
Est. Value
About This Home
This home is located at 1901 Nancita Cir, Placentia, CA 92870 and is currently estimated at $4,368,643, approximately $309 per square foot. 1901 Nancita Cir is a home located in Orange County with nearby schools including Glenview Elementary School, Bernardo Yorba Middle School, and Independence Christian School.
Ownership History
Date
Name
Owned For
Owner Type
Purchase Details
Closed on
Apr 9, 2014
Sold by
1901 Nancita Llc
Bought by
Rygi Properties Llc
Current Estimated Value
Home Financials for this Owner
Home Financials are based on the most recent Mortgage that was taken out on this home.
Original Mortgage
$1,104,500
Outstanding Balance
$839,943
Interest Rate
4.35%
Mortgage Type
Commercial
Estimated Equity
$3,528,700
Purchase Details
Closed on
Oct 24, 2007
Sold by
Bonner R Keith and Bonner Gloria
Bought by
Arciero Philip and Arciero Florence L
Home Financials for this Owner
Home Financials are based on the most recent Mortgage that was taken out on this home.
Original Mortgage
$1,400,000
Interest Rate
6.27%
Mortgage Type
Commercial
Purchase Details
Closed on
Dec 1, 1997
Sold by
Smk Consulting Corp
Bought by
Bonner R Keith and Bonner Gloria
Home Financials for this Owner
Home Financials are based on the most recent Mortgage that was taken out on this home.
Original Mortgage
$534,289
Interest Rate
7.31%
Mortgage Type
Commercial
Create a Home Valuation Report for This Property
The Home Valuation Report is an in-depth analysis detailing your home's value as well as a comparison with similar homes in the area
Home Values in the Area
Average Home Value in this Area
Purchase History
| Date | Buyer | Sale Price | Title Company |
|---|---|---|---|
| Rygi Properties Llc | $2,140,000 | Chicago Title Company | |
| Arciero Philip | -- | Stewart Title Of Ca Inc | |
| Bonner R Keith | $890,000 | First American Title Ins Co |
Source: Public Records
Mortgage History
| Date | Status | Borrower | Loan Amount |
|---|---|---|---|
| Open | Rygi Properties Llc | $1,104,500 | |
| Previous Owner | Arciero Philip | $1,400,000 | |
| Previous Owner | Bonner R Keith | $534,289 | |
| Closed | Bonner R Keith | $190,638 |
Source: Public Records
Tax History Compared to Growth
Tax History
| Year | Tax Paid | Tax Assessment Tax Assessment Total Assessment is a certain percentage of the fair market value that is determined by local assessors to be the total taxable value of land and additions on the property. | Land | Improvement |
|---|---|---|---|---|
| 2025 | $28,382 | $2,623,343 | $1,497,271 | $1,126,072 |
| 2024 | $28,382 | $2,571,905 | $1,467,912 | $1,103,993 |
| 2023 | $27,920 | $2,521,476 | $1,439,129 | $1,082,347 |
| 2022 | $27,720 | $2,472,036 | $1,410,911 | $1,061,125 |
| 2021 | $27,252 | $2,423,565 | $1,383,246 | $1,040,319 |
| 2020 | $27,221 | $2,398,715 | $1,369,063 | $1,029,652 |
| 2019 | $26,242 | $2,351,682 | $1,342,219 | $1,009,463 |
| 2018 | $25,928 | $2,305,571 | $1,315,901 | $989,670 |
| 2017 | $25,509 | $2,260,364 | $1,290,099 | $970,265 |
| 2016 | $24,997 | $2,216,044 | $1,264,803 | $951,241 |
| 2015 | $24,698 | $2,182,757 | $1,245,804 | $936,953 |
| 2014 | $23,962 | $2,140,000 | $891,520 | $1,248,480 |
Source: Public Records
Map
Nearby Homes
- 1952 Avenida Del Sol
- 1958 Avenida Del Sol
- 1664 Via de la Luna
- 1963 Via de la Luna
- 1833 Taft Ln
- 1663 Oak St
- 146 Los Alamitos Cir
- 2017 Orchard Dr Unit 11
- 2024 Tanforan Ave
- 1645 La Paloma Ave
- 1570 Topeka Ave
- 1572 Lima Way Unit 6
- 1563 Lima Way Unit 5
- 1578 Topeka Ave Unit 2
- 1712 N Glenview Ave
- Plan One Y at Hudson
- Plan Three Y at Hudson
- Plan Three at Hudson
- PLan Three X at Hudson
- Plan One at Hudson
- 506 Fee Ana St
- 625 Fee Ana St
- 701 Fee Ana St
- 1837 E Orangethorpe Ave
- 319 Aqueduct Ct
- 320 S Belmont Ln
- 326 Aqueduct Ct
- 313 Aqueduct Ct
- 314 S Belmont Ln
- 319 S Belmont Ln
- 307 Aqueduct Ct
- 320 Aqueduct Ct
- 308 S Belmont Ln
- 301 Aqueduct Ct
- 313 S Belmont Ln
- 320 S Caliente Ct
- 314 Aqueduct Ct
- 302 S Belmont Ln
- 307 S Belmont Ln
- 308 Aqueduct Ct