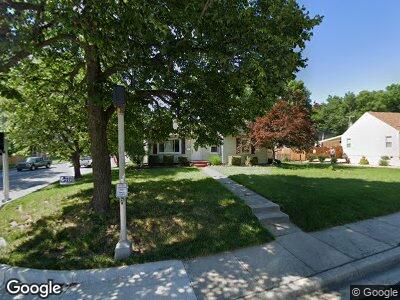
1901 W 71st St Prairie Village, KS 66208
Estimated Value: $347,401 - $502,000
3
Beds
1
Bath
1,231
Sq Ft
$325/Sq Ft
Est. Value
About This Home
This home is located at 1901 W 71st St, Prairie Village, KS 66208 and is currently estimated at $400,100, approximately $325 per square foot. 1901 W 71st St is a home located in Johnson County with nearby schools including Belinder Elementary School, Indian Hills Middle School, and Shawnee Mission East High School.
Ownership History
Date
Name
Owned For
Owner Type
Purchase Details
Closed on
Mar 11, 2014
Sold by
Stamback John P and Sawyer Robert M
Bought by
Nunez Jonathan D and Nunez Heather J
Current Estimated Value
Home Financials for this Owner
Home Financials are based on the most recent Mortgage that was taken out on this home.
Original Mortgage
$25,000
Outstanding Balance
$19,239
Interest Rate
4.36%
Mortgage Type
Credit Line Revolving
Estimated Equity
$380,861
Purchase Details
Closed on
Oct 12, 2006
Sold by
Stamback John P
Bought by
Sawyer Robert M and Stamback John P
Purchase Details
Closed on
Feb 11, 2005
Sold by
Rau Daniel Jason
Bought by
Stamback John P
Home Financials for this Owner
Home Financials are based on the most recent Mortgage that was taken out on this home.
Original Mortgage
$96,800
Interest Rate
6.12%
Mortgage Type
Adjustable Rate Mortgage/ARM
Create a Home Valuation Report for This Property
The Home Valuation Report is an in-depth analysis detailing your home's value as well as a comparison with similar homes in the area
Home Values in the Area
Average Home Value in this Area
Purchase History
| Date | Buyer | Sale Price | Title Company |
|---|---|---|---|
| Nunez Jonathan D | -- | First American Title | |
| Sawyer Robert M | -- | None Available | |
| Stamback John P | -- | Chicago Title Ins Co |
Source: Public Records
Mortgage History
| Date | Status | Borrower | Loan Amount |
|---|---|---|---|
| Open | Nunez Jonathan D | $25,000 | |
| Open | Nunez Jonathan D | $116,300 | |
| Previous Owner | Stamback John P | $131,200 | |
| Previous Owner | Stamback John P | $136,800 | |
| Previous Owner | Stamback John P | $96,800 |
Source: Public Records
Tax History Compared to Growth
Tax History
| Year | Tax Paid | Tax Assessment Tax Assessment Total Assessment is a certain percentage of the fair market value that is determined by local assessors to be the total taxable value of land and additions on the property. | Land | Improvement |
|---|---|---|---|---|
| 2024 | $4,098 | $34,833 | $10,589 | $24,244 |
| 2023 | $3,887 | $32,418 | $10,083 | $22,335 |
| 2022 | $3,634 | $30,199 | $8,768 | $21,431 |
| 2021 | $3,280 | $25,668 | $7,967 | $17,701 |
| 2020 | $3,136 | $24,231 | $7,242 | $16,989 |
| 2019 | $2,992 | $22,850 | $6,036 | $16,814 |
| 2018 | $2,735 | $20,803 | $5,252 | $15,551 |
| 2017 | $2,470 | $18,446 | $4,376 | $14,070 |
| 2016 | $2,445 | $17,997 | $3,498 | $14,499 |
| 2015 | $2,387 | $17,802 | $3,498 | $14,304 |
| 2013 | -- | $16,330 | $3,330 | $13,000 |
Source: Public Records
Map
Nearby Homes
- 1275 W Gregory Blvd
- 2114 W 71st St
- 1264 W 71st Terrace
- 2207 W 71st St
- 2226 W 71st Terrace
- 1911 Romany Rd
- 2300 W 71st Terrace
- 2219 W 70th Terrace
- 1225 Romany Rd
- 1201 W 71st Terrace
- 1037 W Gregory Blvd
- 2014 W 74th St
- 1224 Arno Rd
- 7405 State Line Rd
- 1232 W 69th St
- 7345 Mercier St
- 2601 W 71st Terrace
- 1212 W 69th St
- 7345 Booth St
- 825 W 71st Terrace
- 1901 W 71st St
- 1909 W 71st St
- 1291 W Gregory Blvd
- 1900 W 71st Terrace
- 2001 W 71st St
- 1900 W 71st St
- 1287 W Gregory Blvd
- 2002 W 71st Terrace
- 1906 W 71st St
- 1296 W 71st Terrace
- 2009 W 71st St
- 2000 W 71st St
- 2006 W 71st Terrace
- 1283 W Gregory Blvd
- 1292 W 71st Terrace
- 1290 W Gregory Blvd
- 2015 W 71st St
- 1279 W Gregory Blvd
- 1288 W 71st Terrace
- 2010 W 71st Terrace