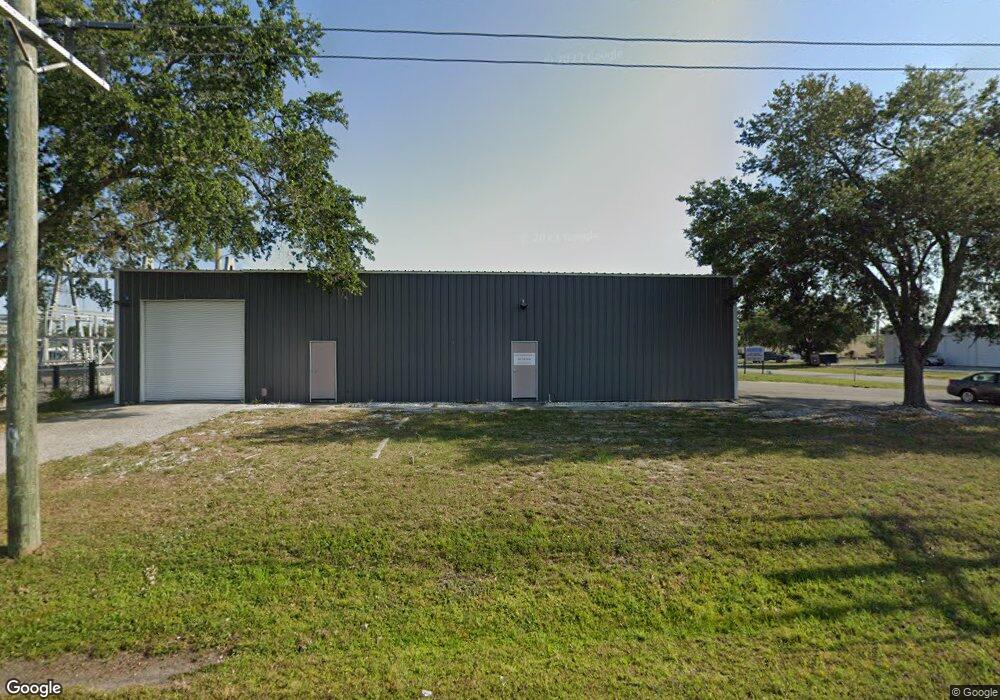
1901 Whitfield Park Loop Sarasota, FL 34243
Estimated Value: $647,000 - $875,456
--
Bed
--
Bath
3,750
Sq Ft
$204/Sq Ft
Est. Value
About This Home
This home is located at 1901 Whitfield Park Loop, Sarasota, FL 34243 and is currently estimated at $763,485, approximately $203 per square foot. 1901 Whitfield Park Loop is a home located in Manatee County with nearby schools including Kinnan Elementary School, Electa Lee Magnet Middle School, and Southeast High School.
Ownership History
Date
Name
Owned For
Owner Type
Purchase Details
Closed on
Aug 18, 2014
Sold by
Wootton Properties Llc
Bought by
Austin Engineering & Restoration Llc
Current Estimated Value
Home Financials for this Owner
Home Financials are based on the most recent Mortgage that was taken out on this home.
Original Mortgage
$164,000
Outstanding Balance
$111,303
Interest Rate
4.19%
Mortgage Type
Commercial
Estimated Equity
$652,182
Purchase Details
Closed on
Dec 5, 2013
Sold by
Two Twelve Inc
Bought by
Wootton Properties Llc
Purchase Details
Closed on
Nov 12, 2010
Sold by
Earp Pamela A
Bought by
Two Twelve Inc
Home Financials for this Owner
Home Financials are based on the most recent Mortgage that was taken out on this home.
Original Mortgage
$225,000
Interest Rate
4.33%
Mortgage Type
Commercial
Purchase Details
Closed on
Dec 9, 1997
Sold by
Earp C Robert and Earp Pamela Ann
Bought by
Earp Charles R
Create a Home Valuation Report for This Property
The Home Valuation Report is an in-depth analysis detailing your home's value as well as a comparison with similar homes in the area
Home Values in the Area
Average Home Value in this Area
Purchase History
| Date | Buyer | Sale Price | Title Company |
|---|---|---|---|
| Austin Engineering & Restoration Llc | $210,000 | Horizon Title | |
| Wootton Properties Llc | $225,000 | Attorney | |
| Two Twelve Inc | $180,000 | Horizon Title | |
| Earp Charles R | -- | -- |
Source: Public Records
Mortgage History
| Date | Status | Borrower | Loan Amount |
|---|---|---|---|
| Open | Austin Engineering & Restoration Llc | $164,000 | |
| Previous Owner | Two Twelve Inc | $225,000 |
Source: Public Records
Tax History Compared to Growth
Tax History
| Year | Tax Paid | Tax Assessment Tax Assessment Total Assessment is a certain percentage of the fair market value that is determined by local assessors to be the total taxable value of land and additions on the property. | Land | Improvement |
|---|---|---|---|---|
| 2025 | $6,514 | $354,871 | $129,838 | $225,033 |
| 2024 | $6,514 | $353,374 | $148,750 | $204,624 |
| 2023 | $6,078 | $322,464 | $148,750 | $173,714 |
| 2022 | $5,708 | $300,540 | $85,250 | $215,290 |
| 2021 | $5,267 | $289,893 | $60,500 | $229,393 |
| 2020 | $5,138 | $274,628 | $60,500 | $214,128 |
| 2019 | $4,837 | $261,004 | $60,500 | $200,504 |
| 2018 | $4,272 | $208,477 | $76,335 | $132,142 |
| 2017 | $3,879 | $203,029 | $0 | $0 |
| 2016 | $3,534 | $170,024 | $0 | $0 |
| 2015 | $3,548 | $174,645 | $0 | $0 |
| 2014 | $3,548 | $170,000 | $0 | $0 |
| 2013 | $2,472 | $103,934 | $51,300 | $52,634 |
Source: Public Records
Map
Nearby Homes
- 6515 15th St E Unit E4
- 6515 15th St E Unit L14
- 6515 15th St E Unit C18
- 6515 15th St E Unit G14
- 6515 15th St E
- 6515 15th St E Unit G17
- 6515 15th St E Unit G18
- 6515 15th St E Unit B-12
- 6515 15th St E Unit C02
- 6515 15th St E Unit J11
- 6515 15th St E Unit L-21
- 6515 15th St E Unit B02
- 6515 15th St E Unit K5
- 1219 70th Dr E
- 1320 Magellan Dr
- 1147 Longfellow Rd Unit 157C
- 1143 Longfellow Rd
- 1125 Longfellow Way Unit 125B
- 1190 Longfellow Way Unit 135-C
- 1112 Longfellow Rd
- 1909 Whitfield Park Loop
- 2017 Whitfield Park Dr
- 2121 Whitfield Park Dr
- 2150 Whitfield Ave
- 1933 Whitfield Park Loop
- 1932 Whitfield Park Loop
- 2061 Whitfield Park Ave
- 1760 Whitfield Ave
- 2010 Whitfield Park Loop
- 2123 Whitfield Park Ave
- 1939 Whitfield Park Loop
- 2152 Whitfield Park Ave
- 2011 Whitfield Park Loop
- 2041 Whitfield Park Loop Unit F
- 2210 & 2152 Whitfield Park Ave
- 2031 Whitfield Park Loop
- 2021 Whitfield Park Loop Unit B
- 2021 Whitfield Park Loop
- 2015 Whitfield Park Loop
- 2025 Whitfield Park Loop Unit C